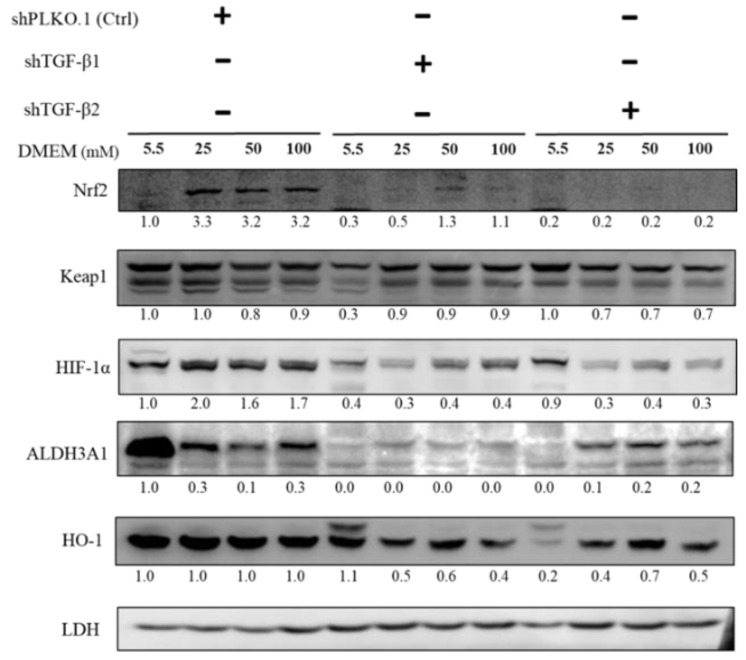
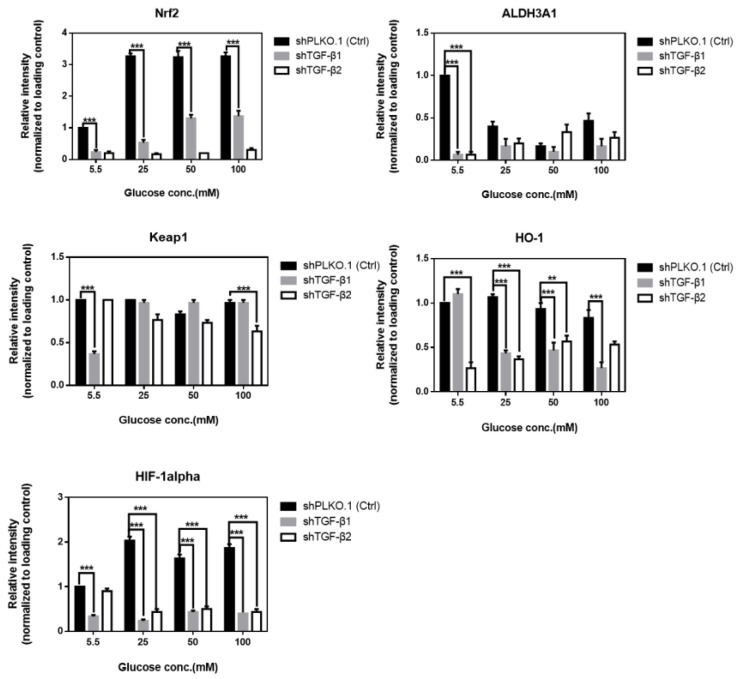
Figure 5.
Immunoblot analysis of activation of downstream substrates in TGF-β1/2 knockdown RGC-5 cells with hyperglycemia. Immunoblot analysis of antioxidation pathway-associated proteins (Nrf2, Keap1, HIF-1α, ALDH3A1, and HO-1) in 5.5 mM, 25 mM, 50 mM, and 100 mM glucose supplemented medium. The protein expression values were quantified in relation to the loading control. Data are represented as means ± SEM. **, p < 0.01; ***, p < 0.001; ns, non-significant, when compared to the 5.5 mM group (n = 3).


