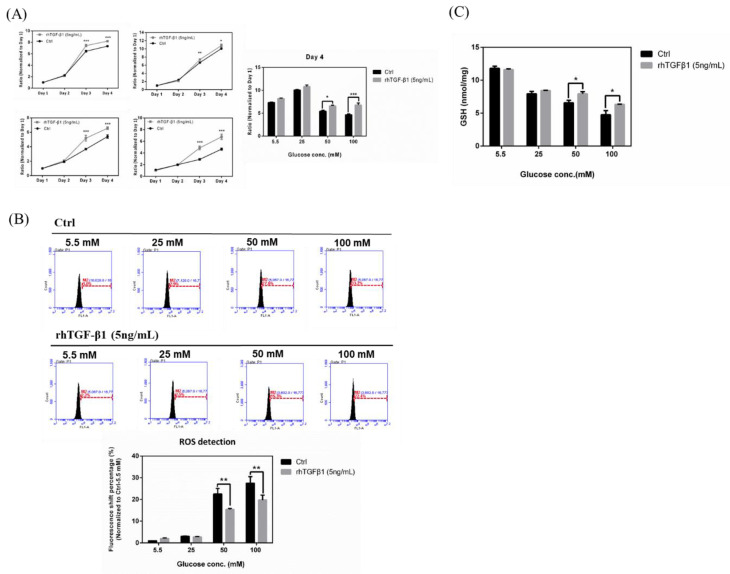
Figure 6.
Effects in RGCs with hyperglycemia with or without (w/o) recombinant TGF-β1 protein (5 ng/mL). (A) Left: Cell proliferation rates under different glucose concentrations were examined from Day 1 to Day 4 using the cell viability assay. The data from Day 2, Day 3, and Day 4 were normalized to Day 1. RGC-5 cells were incubated in 5.5 mM, 25 mM, 50 mM, and 100 mM glucose for long-term exposure and plated into 96-well plates to observe the proliferation rate with or w/o recombinant TGF-β1 protein (5 ng/mL) in different glucose concentrations. Right: Isolated Day 4 data show the differential proliferation rate in RGC-5 cells with recombinant TGF-β1 protein in four glucose concentrations. Data are represented as mean ± SEM. *, p < 0.05; and ***, p < 0.001 when compared to Ctrl. (B) Upper: iROS accumulation effects in RGCs with hyperglycemia with or w/o recombinant TGF-β1 protein (5 ng/mL). Intracellular ROS content were evaluated by the APF staining method on RGC-5 cell cultures following 3 weeks at different glucose concentrations (5.5 mM, 25 mM, 50 mM, and 100 mM glucose) with or w/o recombinant TGF-β1 protein (5 ng/mL). After exposure, 106 cells were incubated with APF at a specific concentration (5 μM) in PBS. Intracellular ROS generation was quantified by flow cytometry. (n = 3) Lower: Relative fluorescence shift percentage was quantified and normalized with respect to the Ctrl (5.5 mM). Data derived from three independent experiments are presented as mean ± SEM. **, p < 0.01 when compared to Ctrl. (C) GSH content in RGCs with hyperglycemia with or w/o recombinant TGF-β1 protein (5 ng/mL). Dose responses involving total GSH contents in RGC-5 cells treated with 5.5 mM, 25 mM, 50 mM and 100 mM glucose concentration medium with or w/o recombinant TGF-β1 protein were assayed. Data are represented as means ± SEM. *, p < 0.05 when compared to the Ctrl.

