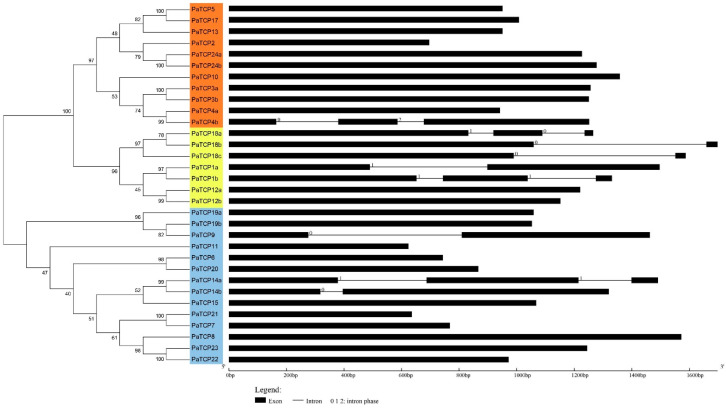
Figure 3.
Exon-intron structures of PaTCP genes. The cladogram was produced by MEGA 7.0 software with the NJ method using the full-length sequences of PaTCP proteins. The orange, yellow and blue rectangles were used to cluster the genes into the CIN, CYC/TB1 and PCF subclades, respectively. 5′UTR and 3′UTR were not shown. The exons and introns are represented by a black block and a thin gray line, respectively. The 0, 1 and 2 denote intron phases.

