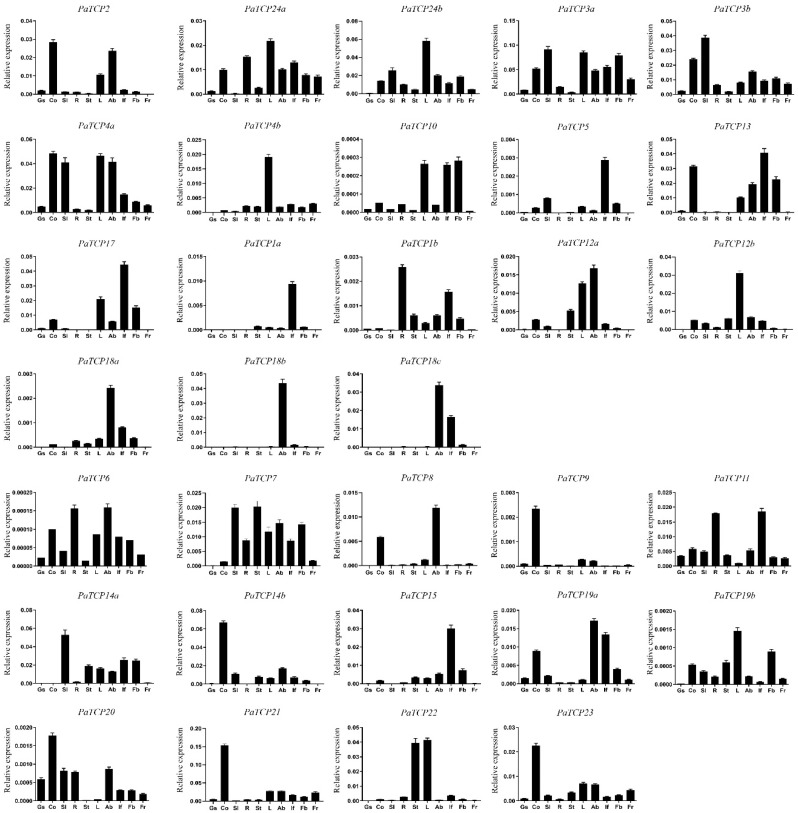
Figure 5.
Expression analysis of PaTCP genes by qPCR. Gs, germinating seeds; Co, cotyledons; Sl, young seedlings; R, roots; St, stems; L, leaves; Ab, axillary buds; If, inflorescences; Fb, flower buds (0.5 cm); Fr, fruits. The relative expression level was normalized to the petunia EF1α gene. For each tissue, three biological replicates were used to calculate the mean values ± SD (standard deviation) with the 2−ΔΔCT method.

