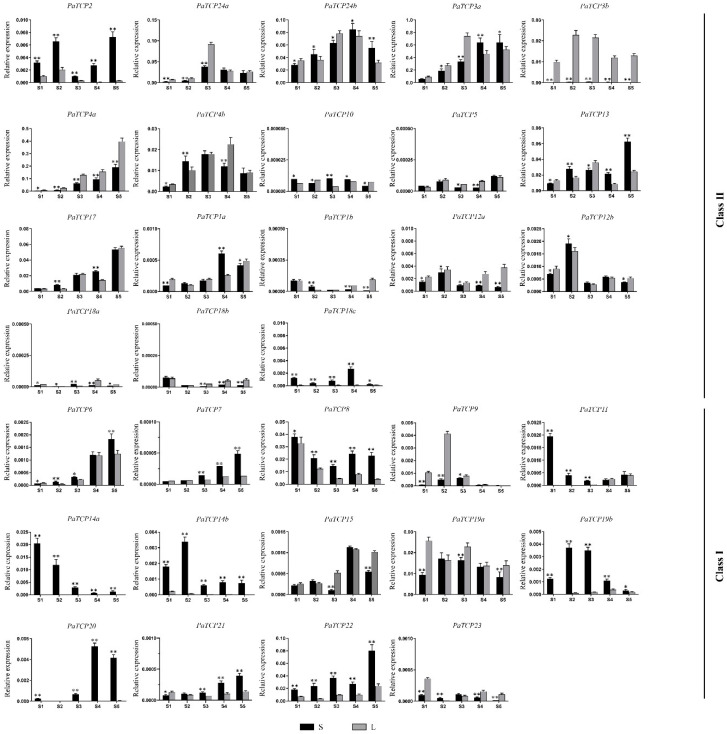
Figure 7.
Transcriptional profiles of PaTCP genes in the large- and small-flowered lines, ‘L’ and ‘S,’ respectively, during different petal developmental stages: young flower buds (<0.5 cm, S1), extending flower buds (when flower buds just enclosed by sepals, S2), pre-anthesis (when flower buds extended to full length, S3), semi-open flowers (S4) and fully blooming flowers before the anthers dehisced (S5). The results were normalized to the expression of the petunia EF1α gene. The mean values ± SD (standard deviation) were calculated from three biological replicates with the 2−ΔΔCT method. The black and dark grey square represented the ‘S’ and ‘L,’ respectively. Asterisks denote statistically significant differences between ‘S’ and ‘L’ at each developmental stage, as determined by Student’s t-test (* p < 0.05, ** p < 0.01).

