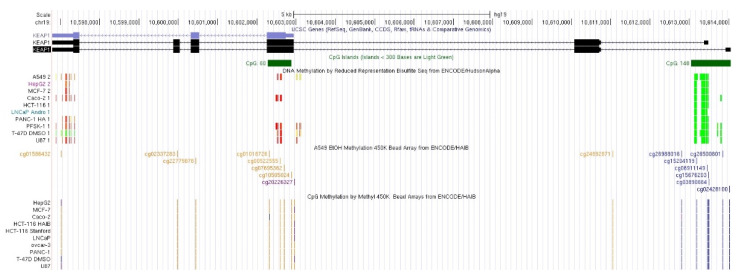
Figure 1.
Schematic representation of the KEAP1 gene structure within the human hg19 genome sequence. The first reference transcript (NM_203500) is located at chr19:10596796-10614054 (strand -, 17259 bp long), while the second one (NM_012289) is located at chr19:10596796-10613481 (16686 bp long). They encode for a 624 aa protein (NCBIID: NP_987096, Uniprot ID: Q14145). Annotation and methylation data retrieved by the University of California, Santa Cruz (UCSC) Genome Browser. From top to bottom: NCBI RefSeq and Consensus CDS tracks for KEAP1 exon/intron structure; predicted CpG islands (“Regulation” >> “CpG Island” track); detected methylation sites (“Regulation” >> “ENCODE DNA Methylation tracks” >> “DNA Methylation by Reduced Representation Bisulfite Seq from ENCODE/Hudson Alpha” and “CpG Methylation by Methyl 450K Bead Arrays from ENCODE/HAIB”. Methylation status of genomic sites is represented through a color gradient vertical bars. Red-orange bars indicate strong methylation signals (i.e., a high relative number of methylated molecules vs. unmethylated molecules in bisulfite sequencing experiments); orange and blue bars indicate strong methylated vs. unmethylated status in 450K array experiments.

