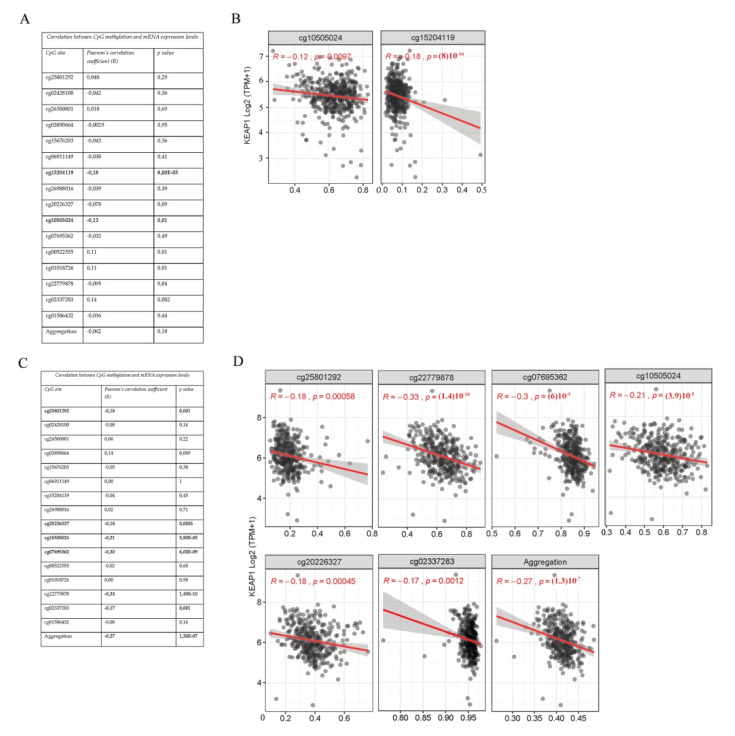
Figure 4.
Correlation analysis between KEAP1 methylation (450 K BeadChip array, beta-values) and its expression levels (RNA-Seq, TPM-normalized read counts) values from TCGA-LUAD all-stages (A) and LUSC all-stages (C) datasets. Scatter plots between β-values (x-axis) and expression values of KEAP1 in LUSC (B) and LUAD (D). TCGA cohort includes the most significant CpG sites and aggregated data of all CpGs. Pearson’s correlation coefficient (R) and significance level (p) are reported for each plot.

