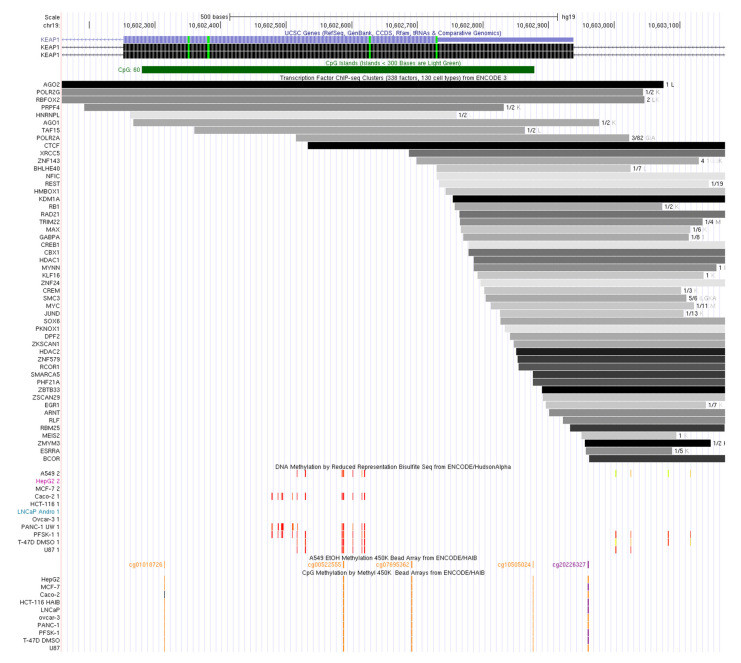
Figure 6.
Schematic representation of KEAP1 exon 3 (hg19 genome sequence). From top to bottom: NCBI RefSeq and Consensus CDS UCSC tracks for KEAP1 exon/intron structure; TFBSs from the ENCODE Project; predicted CpG islands; detected methylation sites. The gray scale intensity of TF binding sites is proportional to the signal strength in the different tested cell lines (darker color indicates stronger signal). Red-orange bars indicate strong methylation signals; orange and blue bars indicate strong methylated vs. unmethylated status in 450K bead array experiments.

