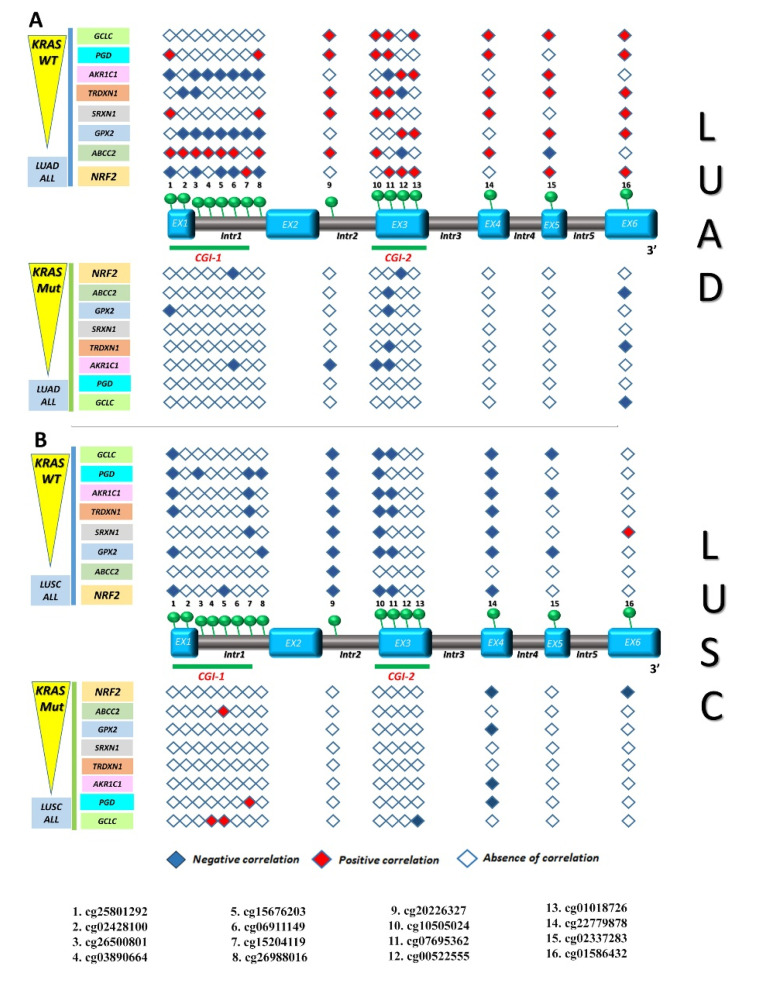
Figure 9.
Correlation between KEAP1 CpGs methylation and transcript levels of NRF2 or its target genes in LUAD and LUSC KRAS wild-type/KRAS mutated subpopulations. The KEAP1 gene structure, is shown in the middle, including exons (sky blue boxes) and introns (brown boxes), as well as two CpG islands: CGI-1 and CGI-2 (both underlined with green bars). A total of 16 CpG sites, marked with green circles, are indicated from 5′ to 3′ genomic localization (listed below). A filled rhombus, corresponding to a KEAP1 CpG site, depicts a significant inverse (blue square) or direct (red square) correlation (R ≤ −0.1; p < 0.05) between methylation and transcript levels of NRF2 or its target genes in LUAD KRAS wild-type/KRAS mutated (A) and particularly in LUSC KRAS wild-type/KRAS mutated (B), in contrast to an empty rhombus indicating no significant correlation. Abbreviations: EX, exon; Intr, intron; CGI-1, CpG Island 1; CGI-2, CpG Island 2; LUSC, lung squamous cell carcinoma; LUAD, lung adenocarcinoma; No-mts, non-metastatic disease stages.

