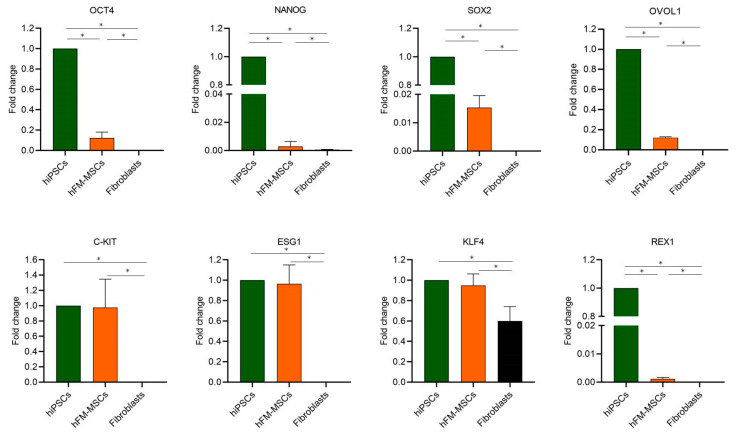
Figure 1.
Gene expression analysis of pluripotency markers in hESC, hFM-MSCs, and hiPSCs. mRNAs of KLF4, ESG1, OVOL1, and REX1 were detected by qPCR. The fold changes were expressed in relation to hiPSCs. 18S was used as the reference gene. Fibroblasts were used as the negative control. The graphs show the mean ± SD of three independent experiments * p < 0.05.

