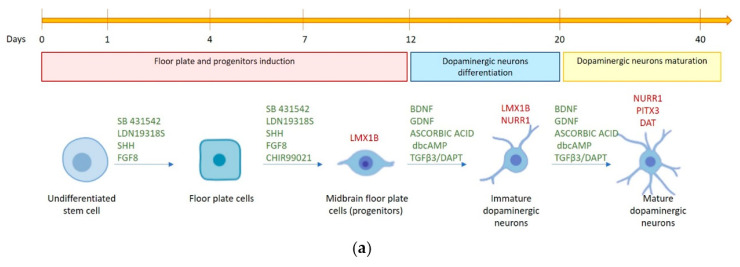
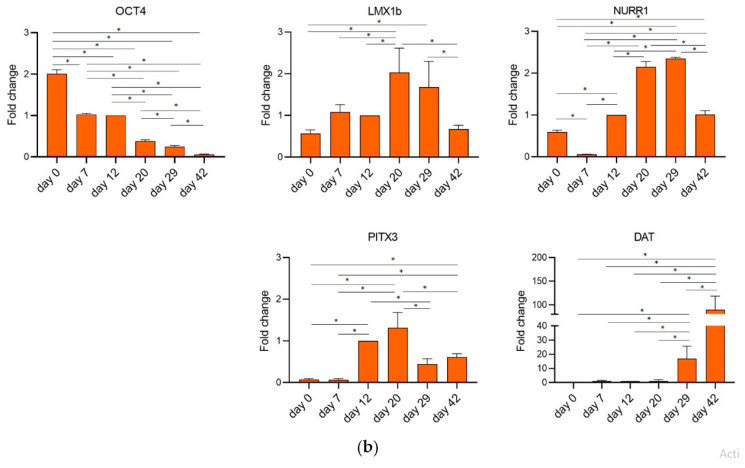
Figure 3.
Gene expression analysis of molecules selectively involved in DA neuron differentiation. (a) Schematic representation of key points of dopaminergic differentiation. In green, the small molecules used for the activation/inhibition of pathways involved in the differentiation process, while in red are reported some of the genes activated at specific stages of DA neuronal differentiation. (b) Gene expression of LMX1b, NURR1, PITX3, and DAT was quantified in hFM-MSCs by qPCR at different time points of DA differentiation. The fold changes were expressed in relation to day 12. 18S was used as reference gene. The graphs show the mean ± SD of three independent experiments * p < 0.05.


