Figure 4.
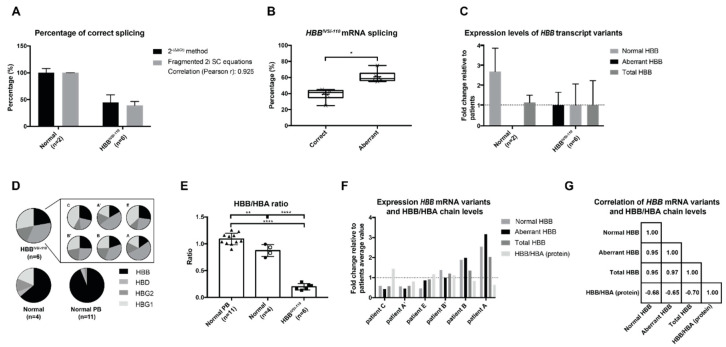
Analysis of in vitro differentiated normal and patient-derived CD34+ cells at the RNA and protein level. (A) Direct comparison of percentages of correct splicing in normal cells (n = 2; SC: 100.0 ± 8.1% vs. 2 −(ΔΔCt) method: 100.0 ± 1.1%) and patient-derived cells (n = 6; SC: 44.4 ± 14.7% vs. 2-(ΔΔCt) method: 39.1 ± 7.3%) calculated by using the 2 −(ΔΔCt) method and absolute quantification method using the fragmented 2i SC equations. Correlation of percentage of correct splicing with the 2 −(ΔΔCt) method vs. fragmented SC equations, Pearson r: 0.925; p value 0.001. (B) Percentage of splicing on day 3 of induced differentiated patient-derived cultures (n = 6), as calculated based on the 2i SC method. Aberrantly spliced transcripts are significantly more abundant than normal transcripts (* p value 0.0146 by paired t test). (C) Relative expression levels of the normal, aberrant and total HBB mRNA variants in normal and patient-derived cultures, normalized to HBA mRNA levels (reference gene) and using as reference patient-derived average values. (D) Proportion of HBB-like globin chains in normal PB (n = 11) and on day 7 of induced differentiated normal (n = 4) and patient-derived (n = 6) cultures, including individual distributions for patient cultures. Patients A and B were each analyzed by two independent cultures (A, A’ and B, B’, respectively). (E) HBB/HBA ratios for samples detailed in panel D: ** p value 0.005; **** p value < 0.0001 by ordinary one-way ANOVA with Tukey correction for multiple comparisons of column means. (F) Illustration of the relative expression levels of the normal, aberrant and total HBB mRNA variants normalized to HBA mRNA levels and of HBB/HBA globin chain ratios in six patient-derived cell cultures (see labels in panel D) as a fold change relative to patient-derived average values. (G) Correlation (Pearson r) analysis of the fold change expression levels (2 −(ΔΔCt) method) of normal, aberrant and total HBB mRNA levels, normalized to HBA mRNA and HBB/HBA globin chain ratios in patient-derived cultures (n = 6), relative to patient-derived average values.

