Figure 4.
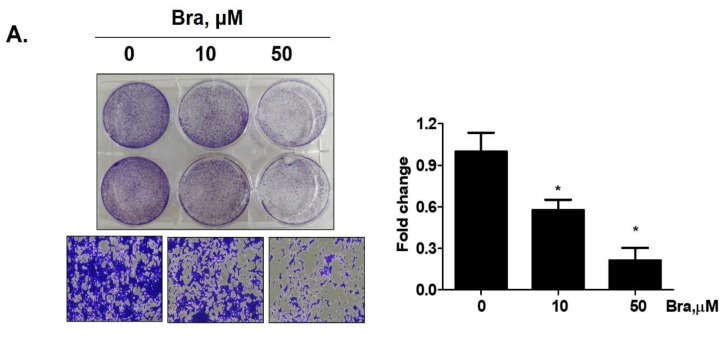
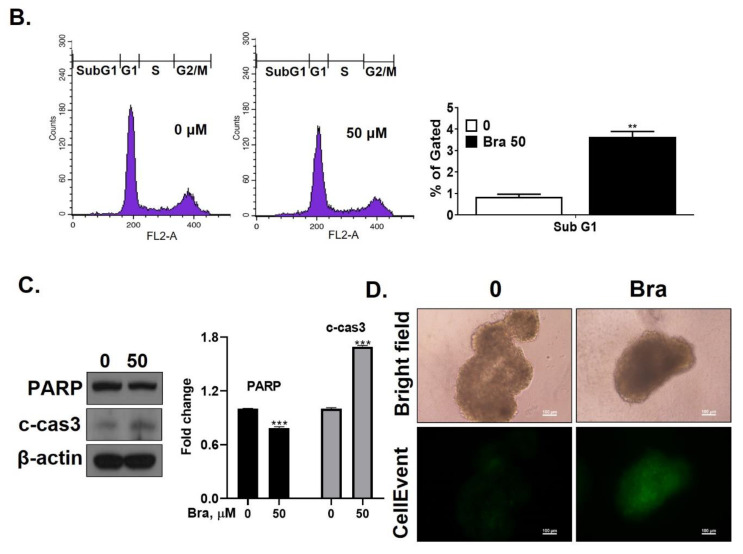
Inhibitory effect of brassicasterol on cell growth in LNCaP cells. (A) 10 and 50 μM of Brassicasterol treated to LNCap Cells for 5 days. The cells were stained with a crystal violet staining solution, and randomly chosen were photographed and resolved in 70% EtOH, and the absorbance was measured using a microplate reader. Data represent mean ± SD. (*) p < 0.05 compared with control. (B) Cell cycle analysis of brassicasterol in LNCaP cells. The LNCaP cells were treated with 50 μM of Brassicasterol for 48 h and analyzed by flow cytometry. Bar graphs showed the quantification of subG1 (%). (**) p < 0.01 compared with control. (C) Brassicasterol-treated (50 μM, 48 h) LNCaP cell lysates were prepared and subject to Western blotting for apoptosis makers (PARP and cleaved caspase-3). Bar graph represents the quantification of interest protein related to β-actin, presents as a fold change of control. (***) p < 0.01 (in comparison to control). (D) Inhibitory effect of brassicasterol on LNCaP 3D tumor organoids growth. 5 days after formed spheroid, 50 μM brassicasterl was treated to the formed spheroids (n = 6 /group) for 48 h.


