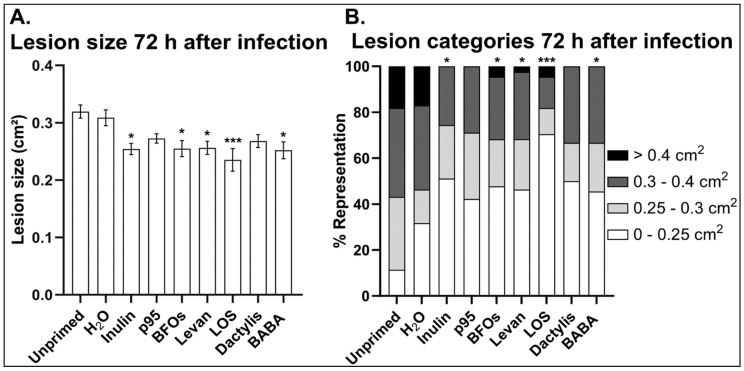
Figure 1.
(A) Average lesion size of fructan-treated (5 g/L) plants compared to untreated and H2O controls. β-Aminobutyric acid (BABA) was used as positive control at 1 mM. Bars represent the mean ± SE of at least 40 biological replicates. (B) Disease severity of fructan-treated plants grouped into four different classes based on the percentage representation of their lesion sizes. Each treatment contained at least 40 biological replicates and was repeated three times with consistent results. Asterisks indicate statistical significance of the mean and SE against H2O treatment using one-way ANOVA followed by Dunnett’s multiple comparison test (* p < 0.05, *** p < 0.001).

