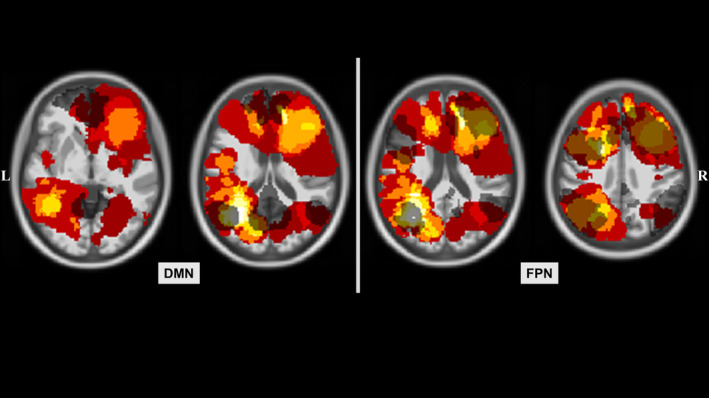
FIGURE 2.

Tumor occurrence map. The distribution of different tumor locations are displayed in the neurological convention for patients with left‐ and right‐hemispheric gliomas (LH PAT and RH PAT). Regions with highest overlap in tumor occurrences are visualized in light yellow and white. The control group's default‐mode‐ and fronto‐parietal network (DMN and FPN, respectively) are overlaid in dark gray in order to visualize the overlap of patients' tumor distribution and network representations in healthy controls
