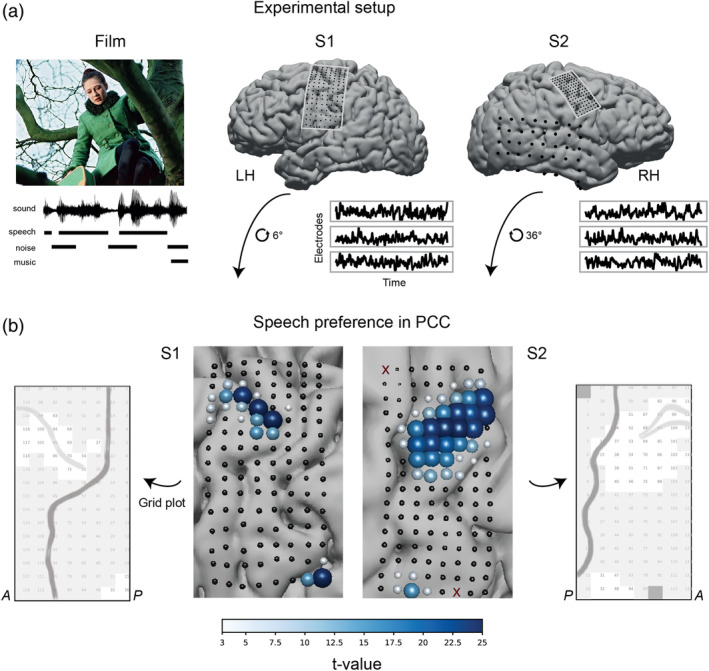
FIGURE 1.

(a) Experimental setup. Two participants watched a full‐length Dutch feature film Minoes (2001). The soundtrack was annotated with fragments of speech, noise, and music sounds. During the experiment, each participant's neural responses were collected with HD ECoG grids placed over the sensorimotor cortex. A low‐density grid in S2 recorded from the temporal lobe. Recordings from a low‐density grid in S1 (not shown) were contaminated with epileptic seizures and were not analyzed. Example HFB time courses in three electrodes are shown per subject. (b) Results of the t tests comparing average HFB activity during speech and nonspeech (noise or music) fragments. HD grids were rotated for the visualization purposes. Each point on the grid is an ECoG electrode. Electrodes excluded from the analyses due to their flat or noisy signal are shown as dark red crosses (two electrodes in S2). Size and color of each electrode represent the t‐value. Positive t‐value represents higher average HFB activity during speech (p < .05, Bonferroni corrected for the number of electrodes). Next to the brain plots we show schematic grid plots, which are used for visualization in further analyses. Each square refers to one HD electrode. Numbers correspond to the electrode indices. Darker gray line shows the outline of the central sulcus. Lighter gray line shows the outline of the superior frontal sulcus. Grayed out electrodes in S2 show electrodes with either flat or noisy signal. These electrodes were excluded from all the analyses. A: anterior direction (towards the frontal lobe), P: posterior direction (toward the occipital lobe)
