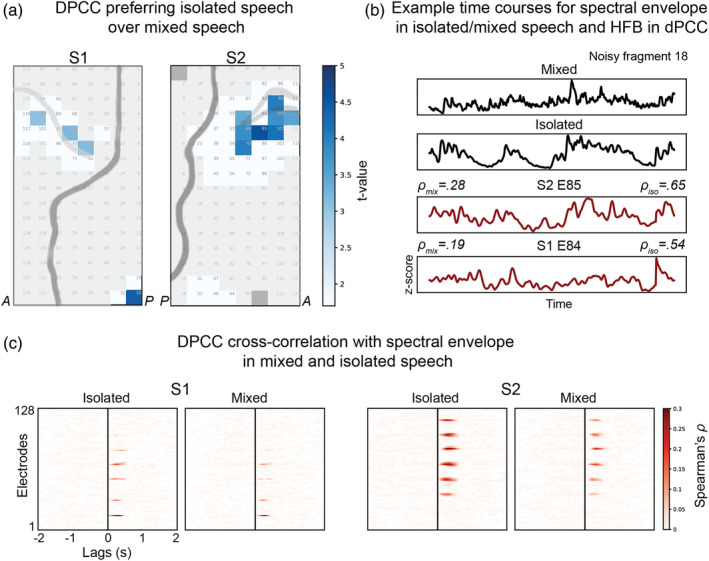
FIGURE 3.

Filtering out of background noise during speech in dPCC. (a) Results of the t tests comparing the amount of correlation to the speech spectral envelope in the isolated speech or mixed sound tracks. The correlation and t test procedures were identical to the ones previously described, except that in this case the analyses were performed on a different set of fragments that only included noisy speech and speech overlapping with other sounds (see Methods for more details). (b) Example time courses for a noisy speech fragment. From top to bottom: spectral envelope of the fragment in the mixed sound track, spectral envelope of the fragment in the isolated speech track, HFB response of electrode 85 in S2 and HFB response of electrode 84 in S1. (c) Cross‐correlation profiles averaged over all noisy fragments separately for mixed and isolated speech tracks
