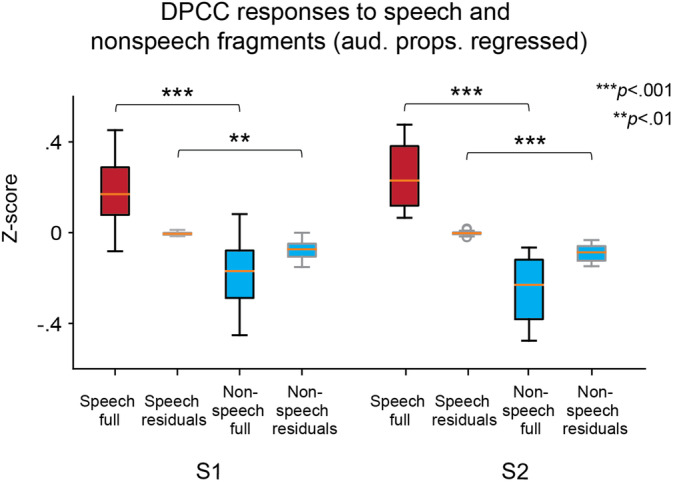
FIGURE 6.

Full and residual HFB responses to speech and nonspeech fragments. Comparison of the average HFB responses to speech (red boxes) and nonspeech (blue boxes) fragments. Original HFB data were used (“full,” boxes with a black outline), as well as the residual HFB data from the regression on all auditory properties (aud. props.): spectral envelope, pitch, rhythmic phrasal structure (boxes with a gray outline). Comparisons between four types of data (“speech‐full,” “speech‐residual,” “nonspeech‐full,” and “nonspeech‐residual”) were performed using a nonparametric version of ANOVA and t tests. The reported results are significant at p < .01 or p < .001. Boxes show the 25th and 75th percentiles of the z‐scored HFB responses. Caps show 5th and 95th percentiles. Solid line in the middle shows the median
