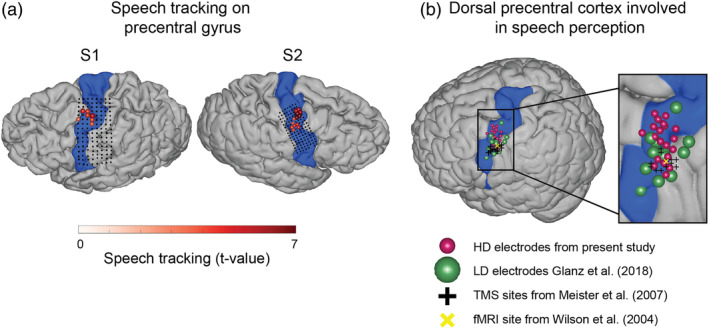
FIGURE 9.

(a) Localization of the speech tracking results in the present study. Colored electrodes show significant tracking of the speech spectral envelope compared with the nonspeech baseline (also shown as a grid plot in Figure 2a). The speech tracking colormap represents t values comparing the Fisher‐transformed correlations to the spectral envelope between speech and nonspeech fragments (see Figure 2 and Methods for details). Area corresponding to the precentral gyrus is shown in each participant (highlighted in blue). Anatomical parcellation was performed in the individual subject space using Freesurfer routines. (b) Comparison of the cortical localization of the present results to the literature (on the standard MNI brain). The present results from S2 (right hemisphere coverage) were projected onto the left hemisphere. The MNI coordinates of the present results were obtained using subject‐specific affine transformation matrices computed with SPM8. The results from the previous studies are projected on the standard brain surface using the MNI coordinates reported in those studies. Only left hemisphere coordinates were used. Area corresponding to the precentral gyrus is shown (highlighted in blue). Anatomical parcellation was performed on the MNI brain using Freesurfer routines. Cortical tracking of the speech spectral envelope from (a) is shown (electrodes in red). Electrodes that show response to both perception and production of speech during real‐world conversations from Glanz et al. (2018) are displayed in green. Center of the area responding to perceived syllables as measured with fMRI and reported in Wilson et al. (2004) is shown (yellow x). Finally, sites, whose stimulation with TMS affected perception of consonants reported in Meister et al. (2007) are displayed as black crosses (one per individual subject)
