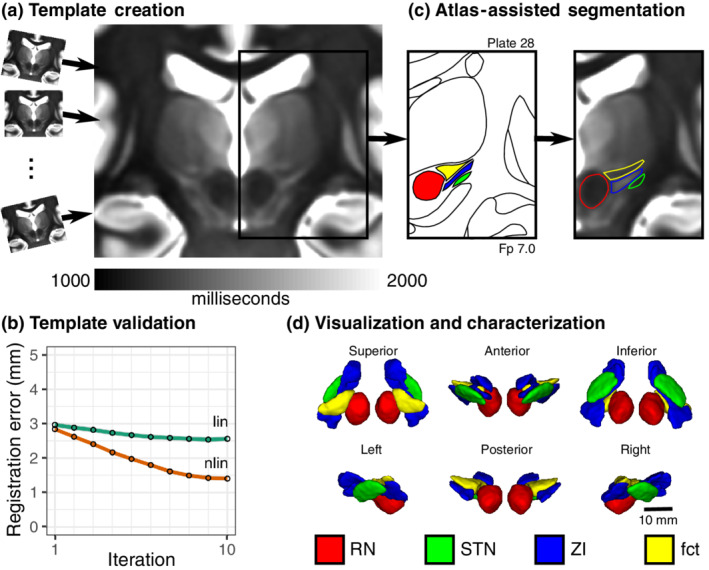
FIGURE 1.

Study workflow for direct visualization and segmentation of the ZI region. (a) To visualize the ZI, we acquired 7 T T1 maps from healthy participants. Individual subject data were pooled using deformable template creation methods to create a within‐study population average. (b) Registration accuracy stabilized into the millimetric range with increasing complexity of registration (linear to nonlinear) and number of iterations (95% confidence intervals shown; details in Materials and Methods). (c) We found that thresholding our T1 maps to a specific range (1,000–2,000 ms) revealed similarities with conventional myelin‐stained atlases, enabling segmentation of the ZI, demonstrated on Plate 28 (7 mm posterior to MCP) of the Schaltenbrand atlas (Schaltenbrand & Wahren, 1977), corresponding to Plate 48 of the Allen Brain THM Atlas (Hawrylycz et al., 2012) and Plate A6 of the Morel Atlas (Morel, Magnin, & Jeanmonod, 1997). Specifically, the ZI could be distinguished as separate from the fasciculus cerebellothalamicus (fct). Note: Equivalent T1 map images are shown to the left and right of the corresponding Schaltenbrand plate without and with segmentation overlay, respectively. (d) Once consensus segmentations were completed, the structures of the ZI were reconstructed in 3D. Note: the RN and STN labels were segmented based on the corresponding T2w images in this dataset
