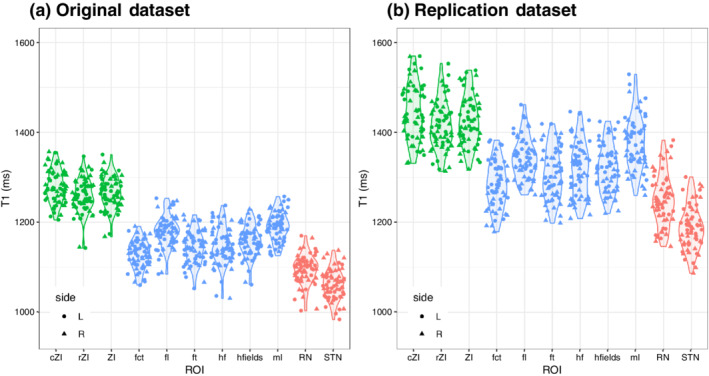
FIGURE 3.

Distinct T1 values for different substructures of the zona incerta region as determined in our original dataset and a replication dataset. The general trends are the same with statistically significant differences in T1 values between the ZI (green) and surrounding white matter (blue) and gray matter (red) regions. The differences between datasets is an observed phenomenon from other studies related to inter‐scanner differences and reviewed in Section 4 and a recent study (Haast et al., 2020). Although different, our analysis demonstrates that for a given scanner these tissue characteristics are relatively precise and allow the separation of these regional structures on the basis of local MRI characteristics alone
