
FIGURE 5.
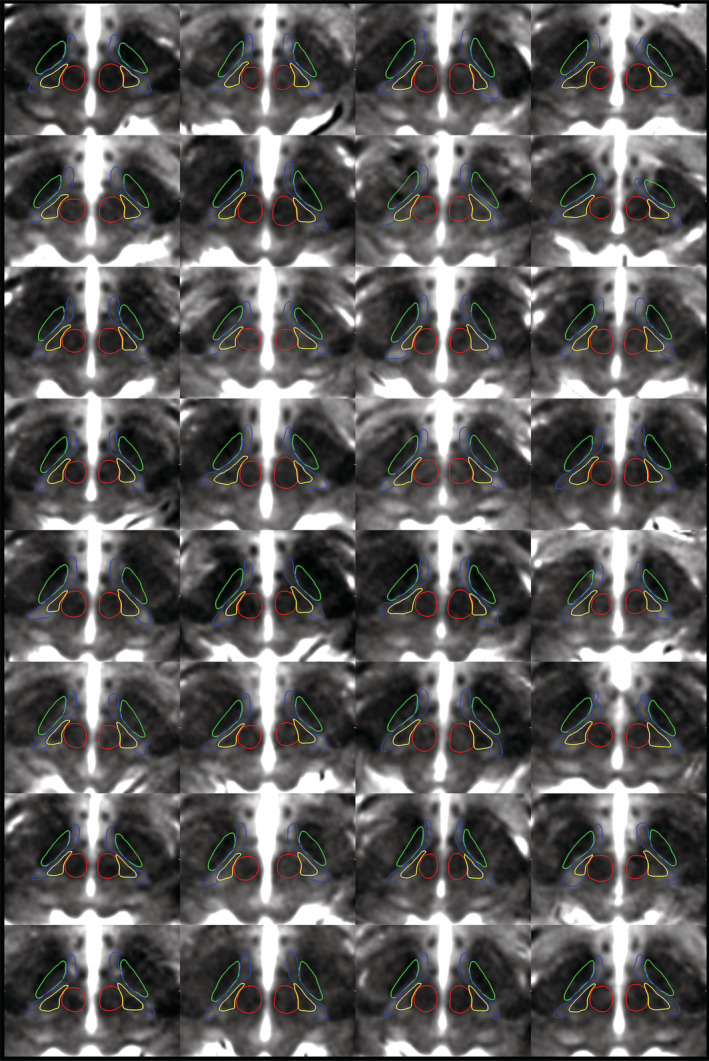
Montage of participant data demonstrating the ability to delineate the zona incerta substructures using high‐resolution T1 maps. Representative axial slices demonstrate the ability to distinguish between the fct (yellow) and ZI (blue) at the level of the RN (red) for each individual participant (N = 32). Note the RN and STN (green) were initially segmented using the T2w images for the same subject fused into T1 space. The T1 maps are thresholded between 1,000–2,000 ms