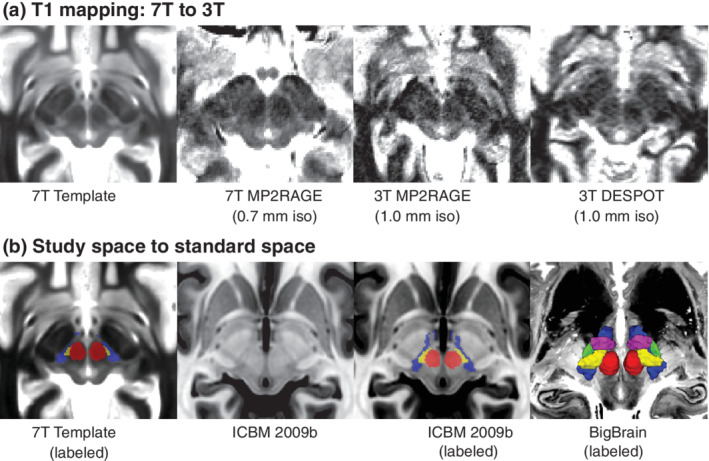
FIGURE 6.

Implications for standard magnetic field strengths and standard spaces. (a) Based on our findings, we investigated whether the ZI substructures could be visualized at standard magnetic field strength. Based on our qualitative assessment, the cZI could be well visualized even at 3T using two different techniques (1.0 mm isotropic resolution, compared to 0.7 mm isotropic resolution at 7 T). (b) The ZI subregions created in this study have been transformed into ICBM 2009b space to benefit the neuroscience community. Note that on the T1w ICBM 2009b template, the cZI appears as a hypointense region while the fasciculus cerebellothalamicus is relatively hyperintense (inverse of T1 map). However, the units in the ICBM space are arbitrary. The 3D reconstructions are overlaid on top of the BigBrain template (Amunts et al., 2013; Xiao et al., 2019)
