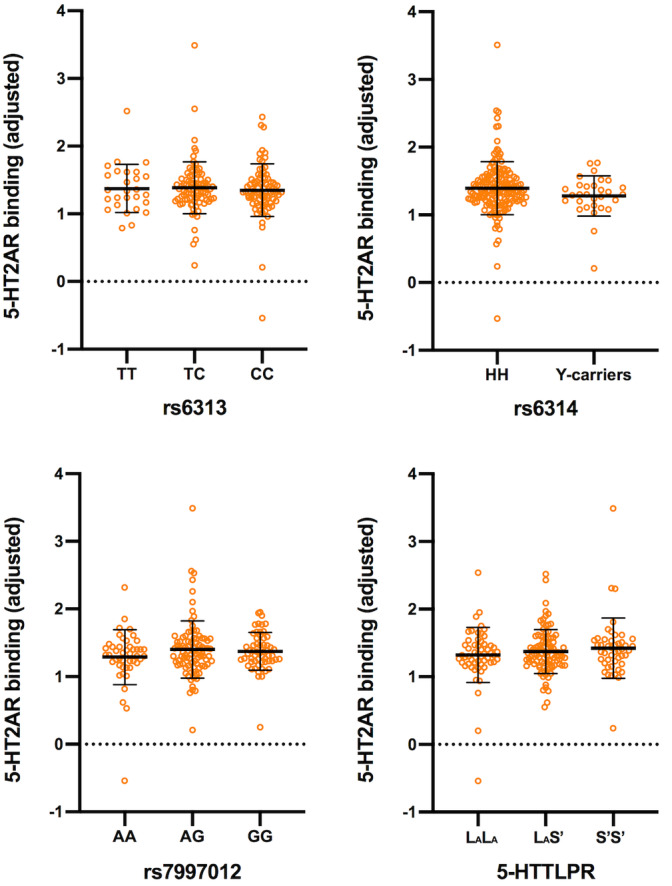
FIGURE 2.

Genotype effects on covariate‐adjusted 5‐HT2AR binding. Orange circles represent covariate‐adjusted (i.e., age, sex, radioligand, positron emission tomography (PET) scanner, MR scanner field strength, and BMI) 5‐HT2AR binding from 195 (HTR2A variants) and 197 (5‐HTTLPR) healthy subjects. Negative binding values result from this adjustment, all observed BP values were greater than 0. Black lines illustrate mean ± SD. No statistically significant effects of rs6313, rs6314, rs7997012, nor 5‐HTTLPR on covariate‐adjusted 5‐HT2AR binding were observed. See Table 3 for parameter estimates and 95% CI. 5‐HT2AR: serotonin 2A receptor. 95% CI: 95% confidence intervals
