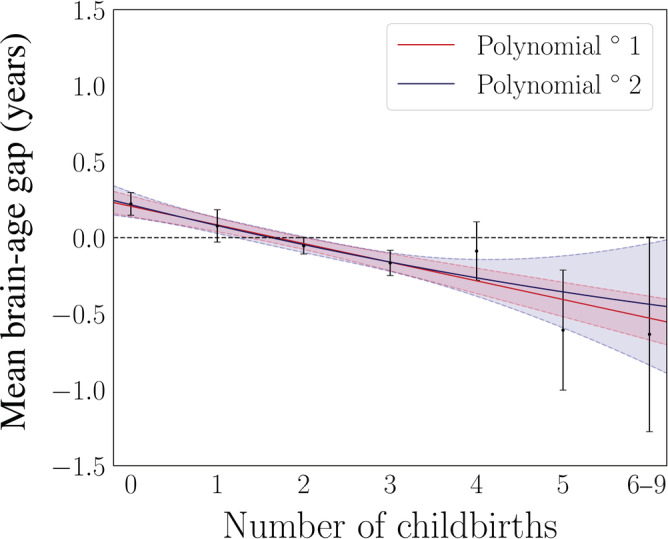
FIGURE 1.

Results from first and second degree polynomial fits for number of childbirths and global brain aging in the newly added participants (N = 8,880). The black points indicate the mean brain age delta ±SE within groups of women based on number of childbirths (x‐axis). The red and blue lines represent the results of the fits, and the shaded areas indicate the 95% confidence intervals for each fit. The horizontal dashed line indicates 0 on the y‐axis. Number of participants in each group: 0 births = 2,065, 1 birth = 1,014, 2 births = 3,912, 3 births = 1,493, 4 births = 311, 5 births = 67, 6 births = 13, 7 births = 3, 8 births = 1, and 9 births = 1. The women with 6–9 children were merged into one gorup to obtain sufficient statistics for least square fits using the SE on the means as weights
