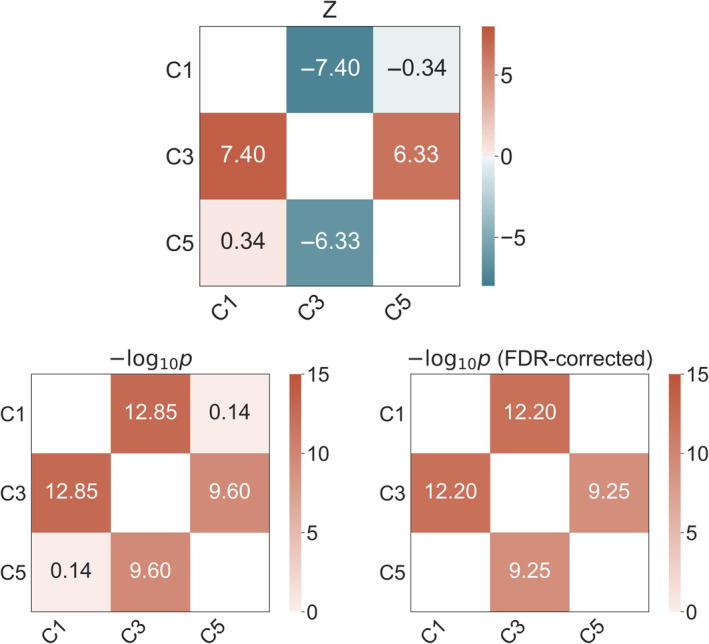
FIGURE 3.

Statistical differences between cluster‐specific associations with number of childbirths. Top plot: Matrix showing pairwise differences between the significant cluster‐specific associations with number of childbirths, based on Z tests for correlated samples (Equation 1). Bottom left plot: Uncorrected −Log10 p‐values of the differences between the cluster‐specific associations. Bottom right plot: −Log10 p‐values corrected for multiple comparisons using false discovery rate correction (FDR), with only significant values (<.05) displayed. C, cluster
