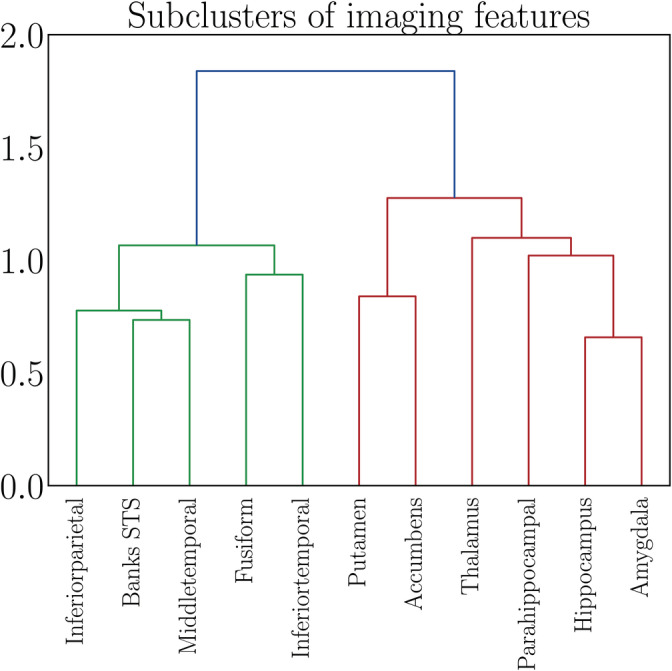
FIGURE 4.

Dendrogram based on hierarchical clustering on the Spearman rank‐order correlations of the features contained in Cluster 3, which showed the strongest association with number of childbirths (see Figure 3). The colors represent clusters of features that are grouped together based on common covariance; subcluster 1 in green and subcluster 2 in red. The y‐axis shows the degree of colinearity, with higher y‐values indicating less colinearity between clusters. STS, superior temporal sulcus
