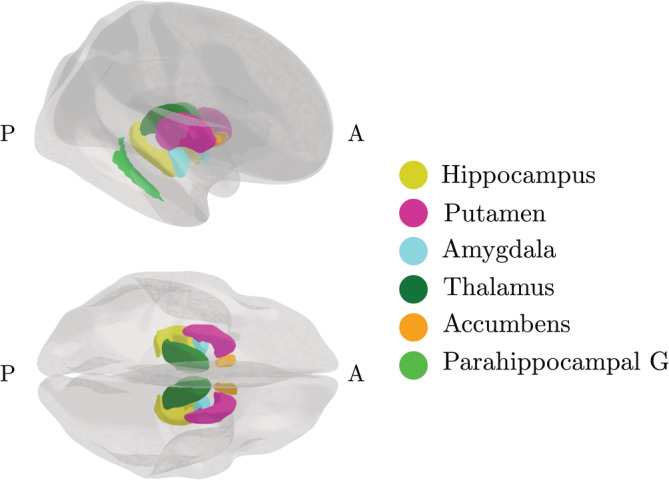
FIGURE 5.

Regions in subcluster 2—the cluster that showed the strongest association with number of previous childbirths. A, anterior; G, gyrus; P, posterior. Figure created using the ggseg plotting tool for brain atlases in R (Mowinckel & Vidal‐Piñeiro, 2019)
