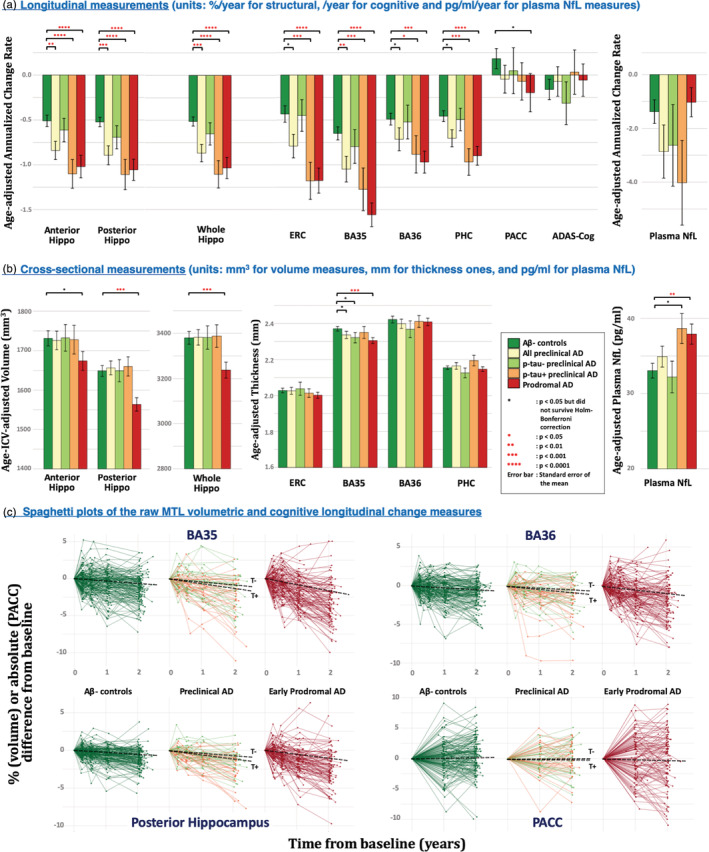
FIGURE 2.

Comparisons of longitudinal (a) and cross‐sectional (b) measurements in discriminating patient groups from Aβ− controls. Spaghetti plots of the raw longitudinal change measurements relative to baseline of representative medial temporal lobe (MTL) subregions and PACC are shown in (c) and the black dashed lines indicate the fitted mean longitudinal change. All the statistical tests are one‐sided. Coloring scheme for the five groups are consistent in the three subplots. AD, Alzheimer's disease; ADAS‐Cog, Alzheimer's Disease Assessment Scale‐Cognitive; Aβ, amyloid‐β; BA35/36, Brodmann area 35/36; ERC, entorhinal cortex; Hippo, hippocampus; NfL, neurofilament light chain; PACC, preclinical Alzheimer's cognitive composite score; PHC, parahippocampal cortex
