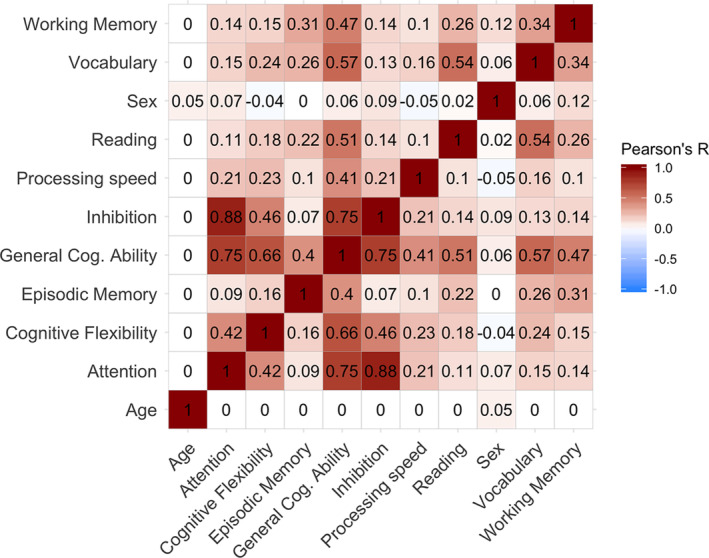
FIGURE 2.

Correlation matrix for age, sex and cognition. The figure depicts Pearson's correlation coefficients for age, sex, general cognitive ability (General Cog. Ability), and individual cognitive sum scores. The red spectrum represents positive correlations, while the blue spectrum represents negative correlations. Sum scores, and by extension general cognitive ability, are residualized by linear and quadratic age
