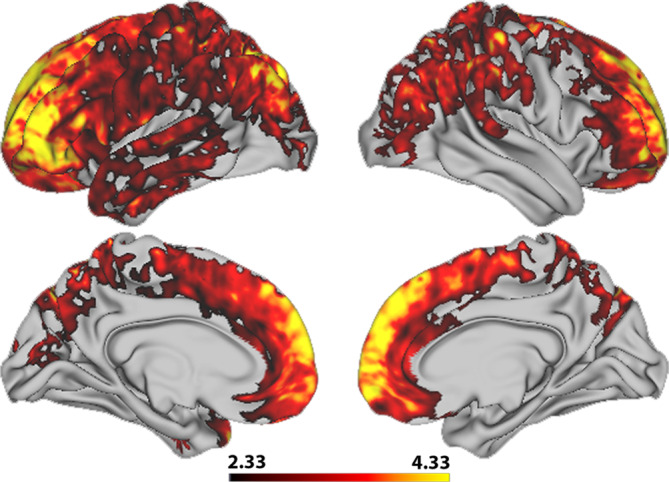
FIGURE 6.

Vertex‐wise associations between T1w/T2w ratio and the interaction between age and sex. The figure depicts a t‐statistics map, masked by familywise error corrected p values across contrasts and thresholded at a minimum –logp of 1.6 to correct for both hemispheres. Warm colors represent a positive interaction effect
