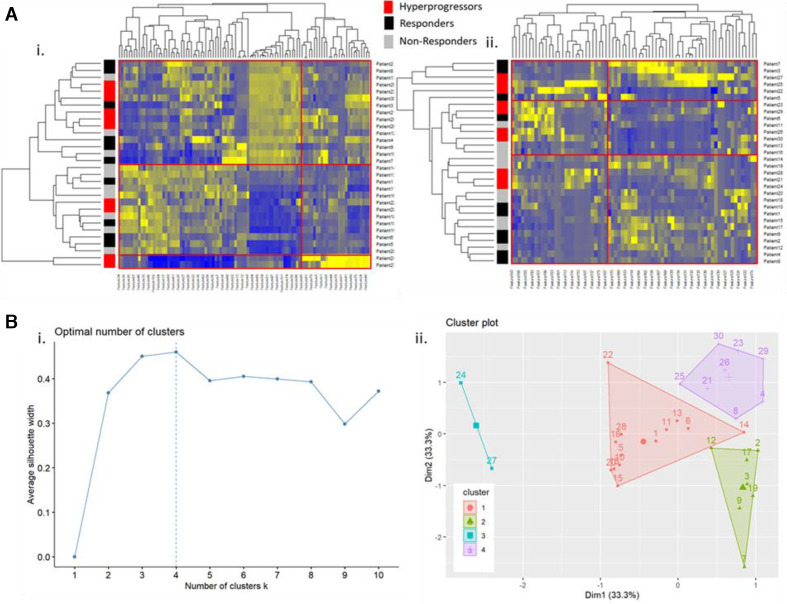
Figure 3.
Unsupervised clustering analysis: (A) heatmaps for (i) radiomics intratumoral and peritumoral features where 78.9% HPs clustered together in cluster 1, (ii) quantitative vessel tortuosity features. (B) K-mean clustering analysis: (i) elbow curve representing an optimum number of clusters formed using the top three principal components after performing principal component analysis on the entire feature cohort. The optimum number of clusters were observed to be four. (ii) clusters after performing clustering using k=4. These clusters had 78.1% compactness within the clusters. Almost all the HP (80%) were clustered in clusters 3 and 4. Responders and non-responders formed clusters 2 and 1. HP, hyperprogressor.

