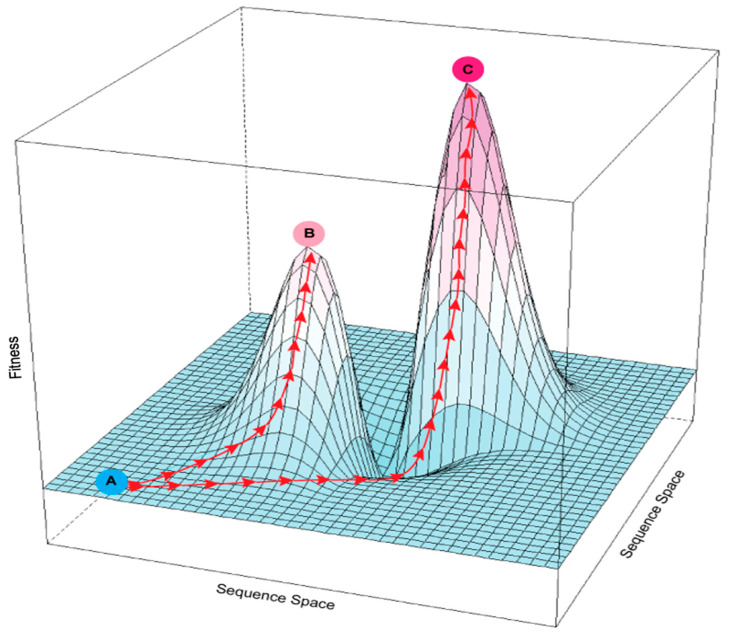
Figure 1.
Rugged fitness landscape with multiple fitness peaks. The x and y axes represent the multidimensional sequence space defined by different possible sites and identities of mutations in an enzyme; the z-axis is fitness as a function of sequence. Red arrows show possible evolutionary paths created by mutation and selection. An enzyme at suboptimal fitness level A could potentially reach local fitness peak B or global optimal peak C. Because the path from A to C passes through a fitness valley, it is more difficult to follow under selection than the continuously upward path from A to B.

