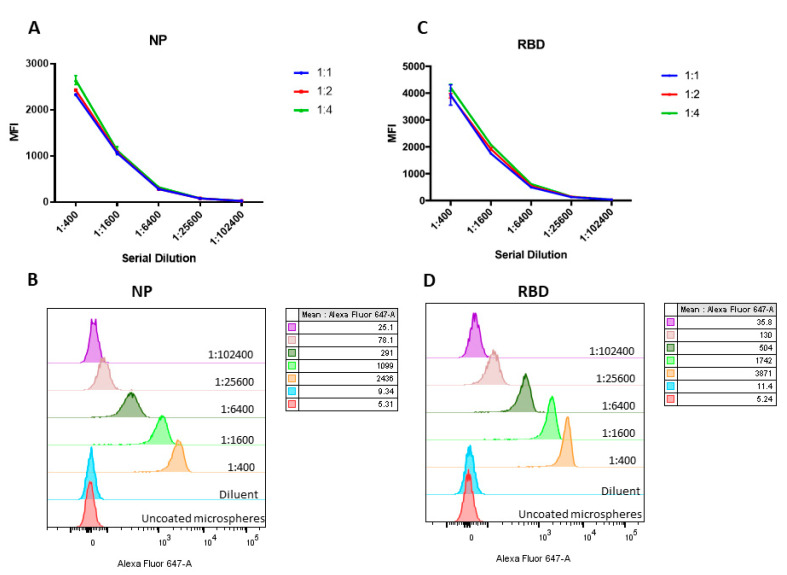
Figure 1.
Determination of optimal microsphere-protein molar ratio for microsphere-based assay. Serum from a COVID-19 patient was used. The mean fluorescent intensity at different microsphere-protein molar ratio are shown for (A) nucleoprotein (NP) and (B) receptor binding domain (RBD), and the corresponding stacked histogram of selected microsphere-protein molar ratio are shown in (C) NP (1:2) and (D) RBD (1:1). Experiment was performed in triplicate with serum specimen collected from 3 different COVID-19 patients and a representative graph is shown. Error bar represents the standard error of mean from 3 replicates.

