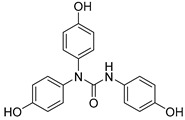
Table 4.
Antioxidant profile of selected stable compounds.
| Comp | Chemical Structure | ORAC a | ABTS a | DPPH PSA IC50 (µM) b | |
|---|---|---|---|---|---|
| 10 min | 2 h | ||||
| 3 |

|
19.2 ± 0.2 | 3.27 ± 0.1 | 8.30 | 6.77 |
| 7 |

|
19.2 ± 0. | 8.12 ± 0.09 | 24.10 | 23.30 |
| 8 |

|
19.3 ± 0.5 | 5.00 ± 0.09 | 150.90 | 64.20 |
| 15 |

|
8.9 ± 0.4 | 1.17 ± 0.01 | ND c | ND c |
| 17 |

|
19.4 ± 0.7 | 3.57 ± 0.00 | 17.92 | 9.60 |
| Resveratrol |

|
8.08 ± 1.2 | 2.13 ± 0.02 | 66.22 | 19.48 |
a µmol of trolox/µmol of pure compound. b The half-maximal inhibitory concentration (IC50) values for the α,α-diphenyl-β-picrylhydrazyl (DPPH) assay correspond to the amount of compound needed to reach 50% of radical scavenging activity (RSA) after 10 min and 2 h of addition. c ND: not determined.
