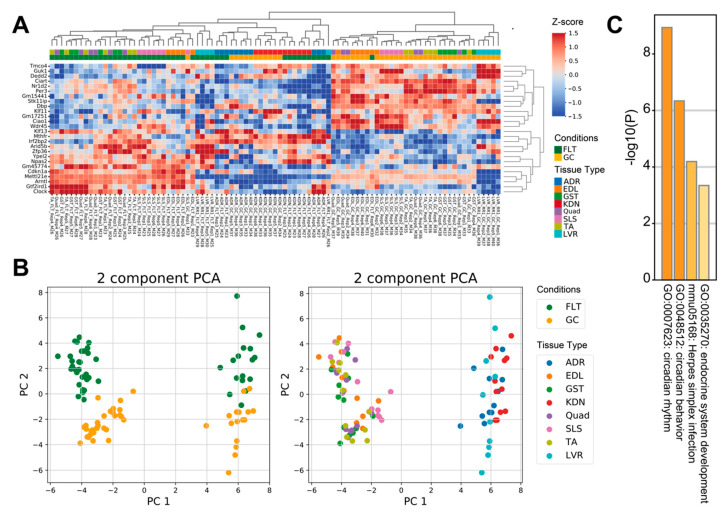
Figure 1.
Differential gene expression between spaceflight and ground control across mice tissues. (A) is the heatmap of the 26 tissue-wide DEGs between FLT and GC. (B) are PCA plots of the 26 tissue-wide DEGs between FLT and GC conditions. PCA plots are colored by conditions (left) and tissue types (right). (C) is the bar chart of enrichment ontology categories in the tissue-wide DEGs between FLT and GC. Abbreviations: FLT, spaceflight mice; GC, ground control mice; ADR, adrenal glands; EDL, extensor digitorum longus; GST, gastrocnemius; KDN, kidneys; Quad, quadriceps; SLS, soleus; TA, tibialis anterior; LVR, liver.

