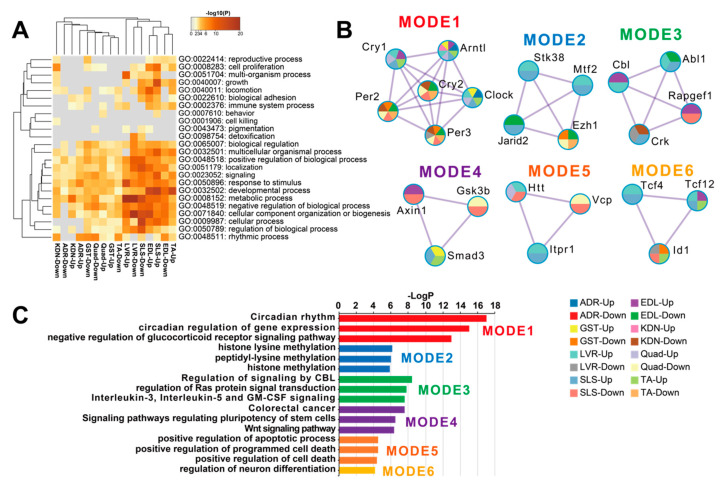
Figure 3.
Functional enrichment analysis of DEGs in each tissue. (A) is the heatmap of the top-level Gene Ontology (GO) biological process categories for DEGs in each tissue. Gray color indicates a lack of significant term. (B) are the clustered PPI networks by MCODE identified from the combined list of all DEGs in each tissue. (C) is the bar plot of clusters of enrichment categories detected by the MCODE algorithm. Abbreviations: Up, up-regulated genes; Down, down-regulated genes.

