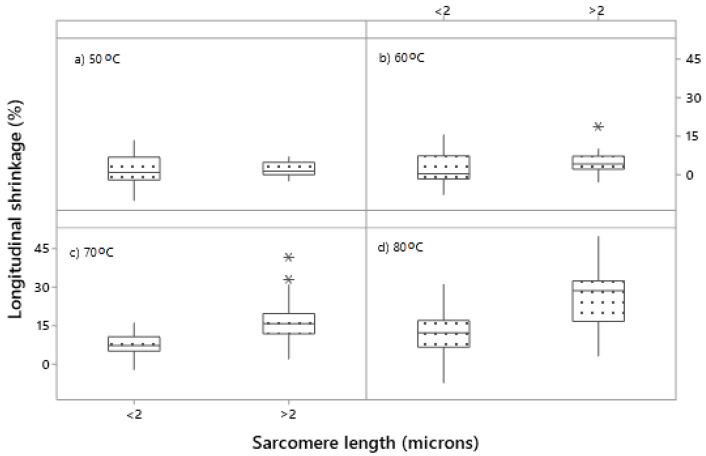
Figure 5.
Relationship between longitudinal shrinkage and sarcomere length. Boxplot of the longitudinal shrinkage of muscles with <2 and >2 µm sarcomere length; cooked to (a) 50 °C, (b) 60 °C, (c) 70 °C, (d) 80 °C; n = 82. A 2-µm threshold was chosen as median of the dataset. Data were combined from three bovine muscles (semitendinosus, biceps femoris and psoas major) from five carcasses. Cooking time was 30 min. after reaching the defined temperature (Tc + 30 min.). Asterisks indicate extreme outliers.

