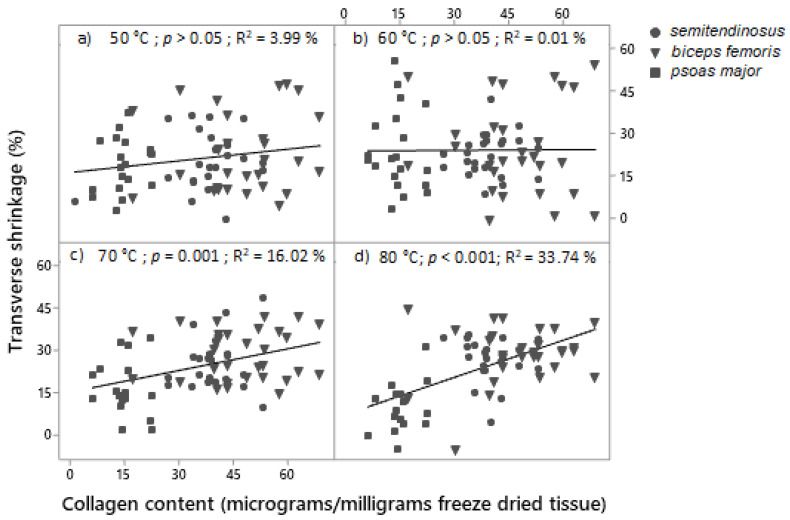
Figure 7.
Regression analysis of the relationship between transverse shrinkage and collagen content. Samples cooked at (a) 50 °C, (b) 60 °C, (c) 70 °C, (d) 80 °C for 30 min (Tc + 30 min.). The p-value presents the significance of the regression, R2 is percent variance of transverse shrinkage explained by collagen content.

