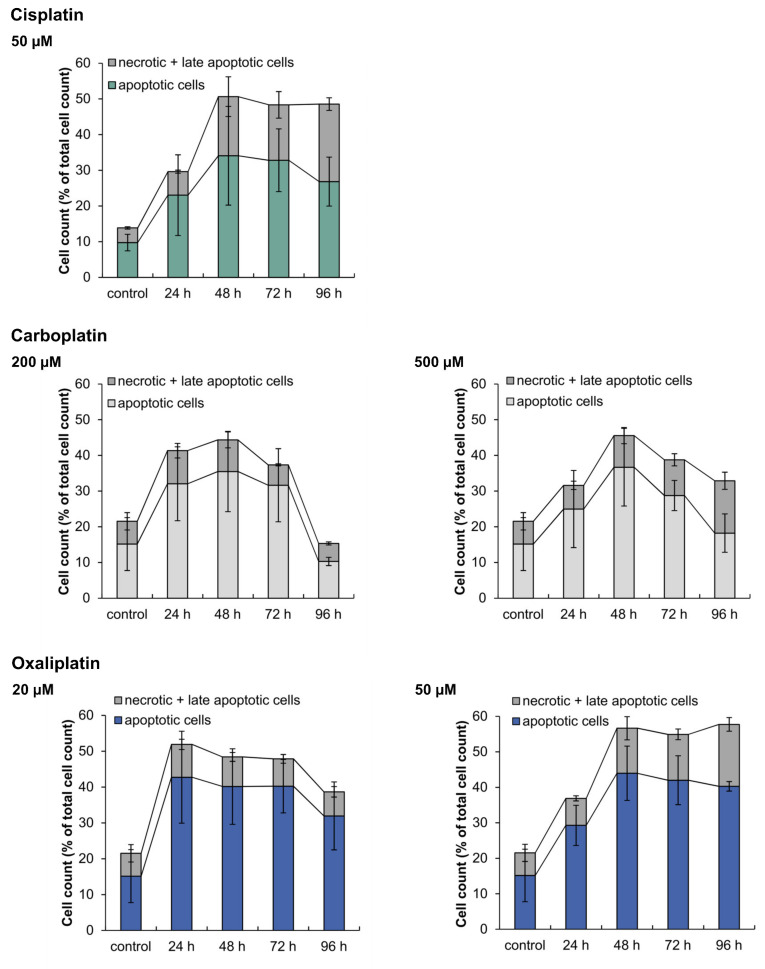
Figure 8.
Analysis of apoptotic and necrotic cells after incubation of A498 cells with cisplatin, carboplatin or oxaliplatin. Cells were incubated for 1 h with cisplatin (50 µM), carboplatin (200, 500 µM) or oxaliplatin (20, 50 µM) followed by postcultivation of 24, 48, 72 or 96 h. To distinguish between apoptotic and necrotic + late apoptotic cells, cells were stained with Annexin V-FITC and propidium iodide (PI). Cell cycle distribution was then analyzed by flow cytometry. The mean values are shown of three independent experiments ± standard deviation. The data for cisplatin are taken from [8].

