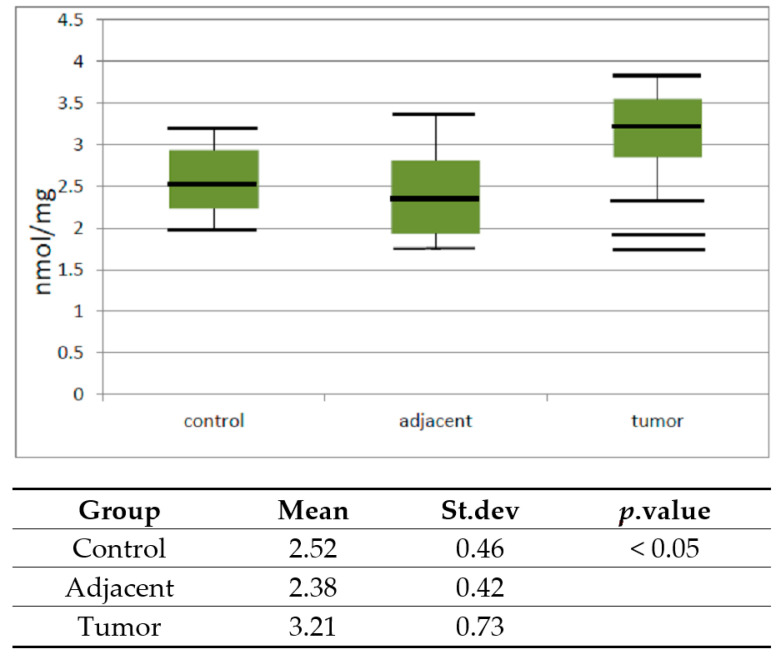
Figure 4.
Vertical boxplot for catalase activity in control healthy tissue, tissue adjacent to tumor and tumor prostate tissue. The median is identified by a line inside the box, the boundaries of the box are interquartile range (IQR). Bars = entire range. Values more than 75th percentile are labelled as extreme and denoted as the horizontal lines beyond the bars.

