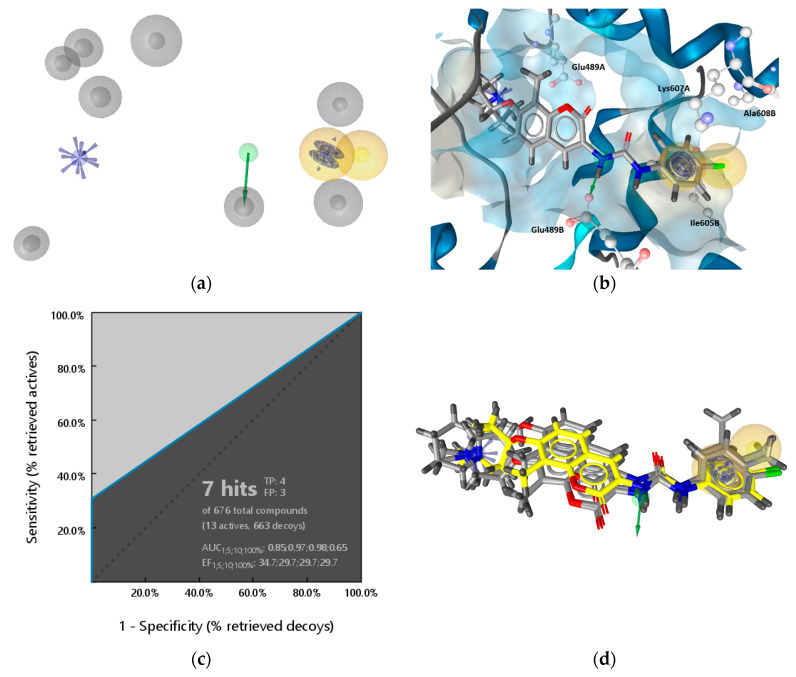
Figure 8.
(a) The molecular dynamics (MD)-derived structure-based (SB) pharmacophore model prioritized for virtual screening and (b) binding mode of 2 with pharmacophore features derived from MD simulations. For clarity, only amino acids interacting with the ligand are shown. The pharmacophore features are as follows: hydrophobic (yellow spheres), aromatic (blue disc), hydrogen bond donor (green arrow), positive ionizable (blue star), exclusion volumes (grey spheres). (c) Resulting ROC plot (curve shown in blue), from virtually screening 676 compounds (13 Hsp90 CTD actives and 663 generated decoys) with the SB pharmacophore model. TP = true positives; FP = false positives; AUC = area under the curve; EF = enrichment factor. (d) Alignment of four hits with SB-model derived from Hsp90β allosteric CTD domain MD simulations. Compound 2 is highlighted in yellow.

