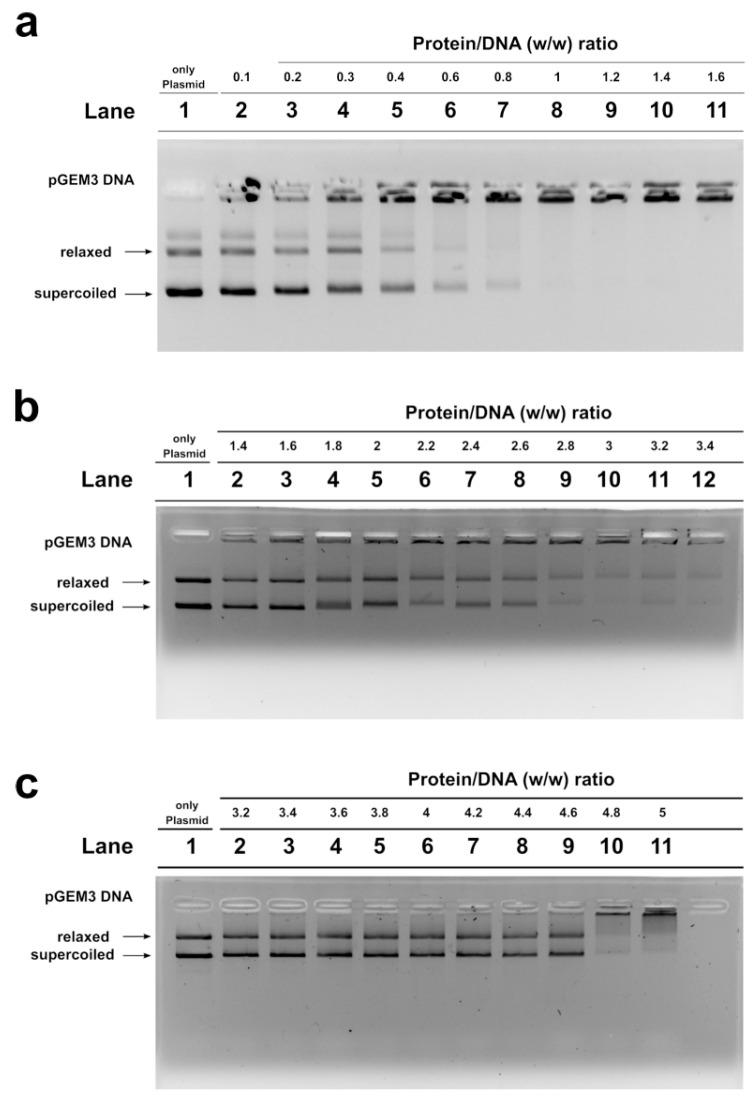
Figure 3.
DNA binding ability of SNBP obtained from: control 1 (a); son (b) and father (c) analyzed by EMSA on 1% agarose gel. Bands on gel representing the state of pGEM3 plasmid DNA incubated in a w/w ratio with increasing amount of SNBP from samples containing: CP/Hr (a); nCP/Hr (b); only–H (c). Panel a from supplementary material of Lettieri et al., 2020 [11]. L-group: low impact area group; EMSA: electrophoresis mobility shift Assay; SNBP: sperm nuclear basic proteins; CP/Hr: canonical protamines/histones ratio; nCP/Hr: not canonical protamines/histones ratio; only-H: only histones and other basic proteins.

