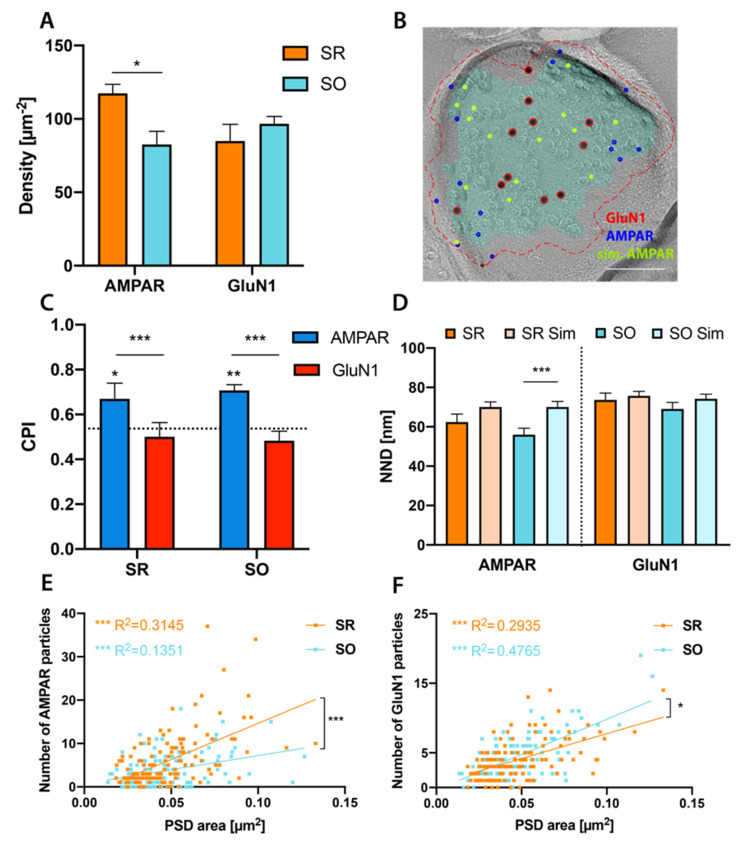
Figure 2.
Glutamate receptor distribution in stratum radiatum (SR) and stratum oriens (SO) PSD. (A): Labeling density of GluA1-3 AMPAR (6 nm) and GluN1 (12 nm). AMPAR labeling is significantly denser in SR than SO (SR: 118 µm−2, SO: 83 µm−2, p = 0.018) while GluN1 labeling density is similar in both strata (SR: 85 µm−2, SO: 97 µm−2, p = 0.49) (n = 4 mice, paired t-test with Holm–Sidak multiple comparison correction). (B): Example image showing Monte-Carlo simulation of randomly distributed AMPAR particles. Red, blue and green circles indicate real GluN1, real AMPAR and simulated AMPAR particles, respectively. Cyan overlay indicates the demarcation of PSD, red dashed line indicates outer rim 30 nm from the demarcation. Scale bar: 100 nm. (C): Center-Periphery index (CPI) of AMPAR and GluN1 particles in SR and SO. Dotted line at 0.536 indicates CPI of randomly distributed particles. In the example image shown in (B), the CPI for AMPAR and GluN1 particles is 0.95 and 0.42, respectively. GluN1 particles are distributed similar to random distribution in both strata (SR: p = 0.97, SO: p = 0.75). AMPAR particles in SR and SO are distributed significantly more peripheral than expected by chance (SR: p = 0.029, SO: p = 0.0059), as well as more peripheral than GluN1 particles (SR: p = 0.0007, SO: p = 0.0001) (n = 4 mice, 3-way analysis of variance (ANOVA) with Sidak’s multiple comparison test; 225 partial and 30 complete PSDs were included in this analysis). (D): Comparison of real and simulated nearest-neighbour differences (NNDs) between AMPAR or GluN1 particles. Real NNDs are significantly smaller than simulations for AMPAR in SO (p = 0.0004, n = 76 synapses) but not in SR (p = 0.13, n = 113 synapses). In contrast, real and simulated NNDs between GluN1 are similar in both strata (SR: p = 0.4, n = 110 synapses; SO: p = 0.13, n = 107 synapses) (paired t-test followed by Holm–Sidak multiple comparison correction). (E,F): Significant positive correlation of number of AMPAR (E) or GluN1 (F) particles with synapse size (AMPAR: SR: R2 = 0.3145, p < 0.0001, SO: R2 = 0.1351, p < 0.0001; GluN1: SR: R2 = 0.2935, p < 0.0001, SO: R2 = 0.4765, p < 0.0001, linear regression followed by Holm–Sidak multiple comparison correction). The regression line was significantly steeper for AMPAR in SR than in SO (F = 14.51, p = 0.0002) and for GluN1 in SO than in SR (F = 4.172, p = 0.031) (SR: n = 135 synapses, SO: n = 120 synapses from 4 mice). * p < 0.05, ** p < 0.01, *** p < 0.001.

