Figure 1.
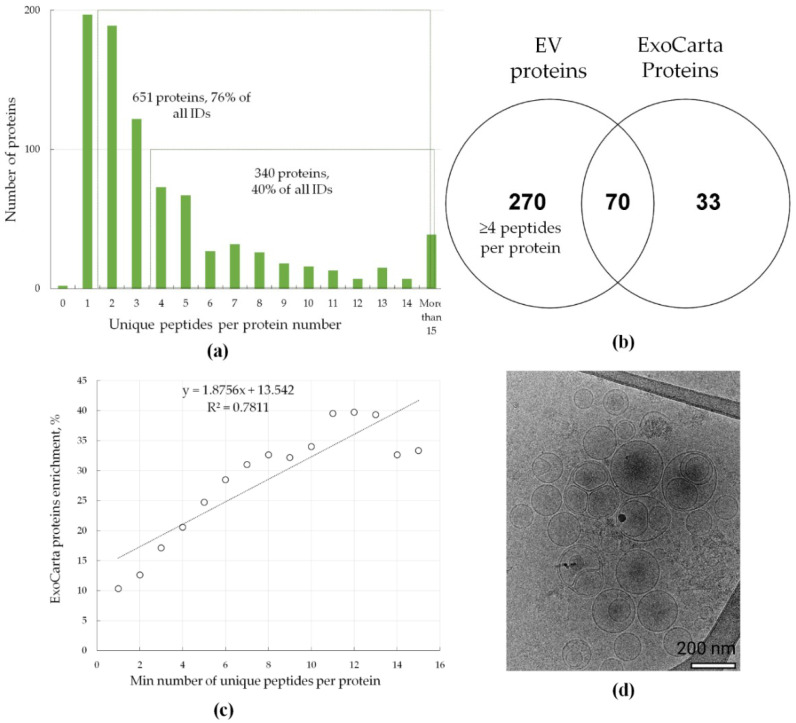
Mass-spectrometric analysis and Cryo-EM characterization of extracellular vesicles (EVs). (a) Distribution of proteins with different numbers of unique peptides per protein. Overall, 850 proteins were identified in all EV samples studied (potential contaminants, false positive identifications, and proteins identified only by peptides containing modifications were excluded). (b) Venn diagram that shows the intersection of proteins that were identified by at least 4 unique peptides (the most confidently identified proteins) and proteins that were often identified in exosomes (http://exocarta.org/exosome_markers_new, ExoCarta Top100 list); (c) correlation between enrichment in ExoCarta protein markers and peptide coverage of the identified proteins. ExoCarta protein enrichment is shown as the percentage of proteins often identified in exosomes (http://exocarta.org/exosome_markers_new, ExoCarta Top100 list) from the total number of identified proteins (y-axis). The peptide count of the identified proteins is shown as the minimal number of unique peptides per protein (x-axis); (d) Cryo-EM image of pooled EVs isolated from LC and CRC cells, bar size is 200 nm.

