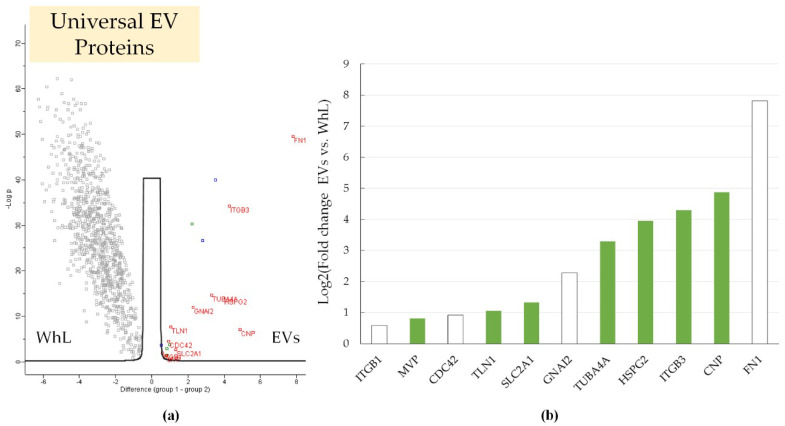
Figure 2.
(a) Volcano plot that shows the differences in the protein abundance in the EV fraction (in red) and in the whole lysate (WhL) (in black) for all cell lines studied. A total of 933 proteins were identified by at least 4 unique peptides per protein and were statistically significant (Student’s t-test, truncation: permutation-based FDR = 0.01, S0 = 1, Perseus 1.6.0.7 software (Max Planck Institute of Biochemistry, Martinsried, Germany). EV markers (11 proteins) are shown by their gene names in red. Normalized data of label free quantification (LFQ) intensities were used for visualization of the protein level. The LFQ intensities were log2 transformed. Differences in protein abundance (considering the log2 transformation) are provided on the x-axis, while -Log p (log10 transformed p-value) is plotted on the y-axis. The blue dots represent proteins APOB, HBB, and HIST1H4A that could be artefacts of exosome isolation. Detailed data are presented in the Supplement 2; (b) universal EV protein markers were more abundant in the EV samples compared to WhL samples; the log2 transformed fold change that reflects the difference in protein abundance is plotted on the y-axis; proteins included in the ExoCarta Top100 list that contains the most often identified in exosome molecules (http://exocarta.org/exosome_markers_new) are shown in white.

