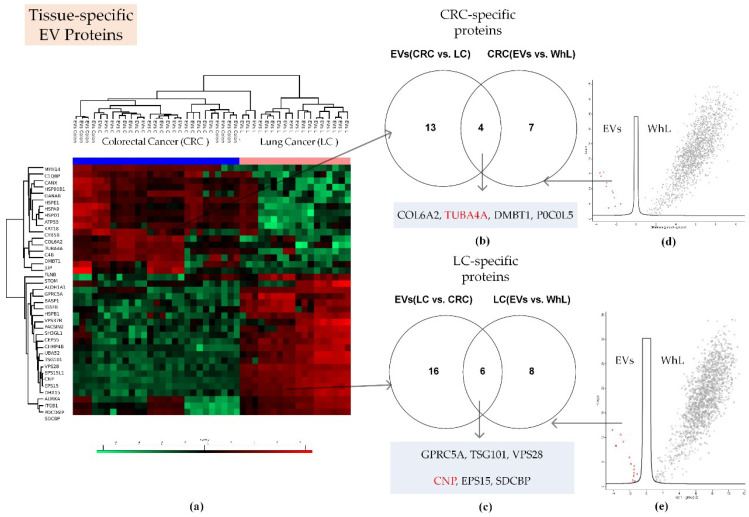
Figure 3.
Proteomic search for tissue-specific EV proteins. (a) Heatmap that compares 39 proteins of EVs derived from lung cancer (LC) and colorectal cancer (CRC) cell lines (Figure S1 shows these proteins in detail); (b) Venn diagram that shows the intersection of proteins that were more abundant in CRC-derived EVs compared to LC-derived EVs, and proteins that were more abundant in EV samples compared to WhL samples of CRC cells; (c) Venn diagram that shows the intersection of proteins that were more abundant in LC-derived EVs compared to CRC-derived EVs and proteins that were more abundant in the EV samples compared to the WhL samples of LC cells; (d) volcano plot that shows the differences in protein abundance in the EV fraction (in red) and in the WhL (in black) for the CRC cell lines. Overall, 1654 proteins identified by at least 4 unique peptides per protein were statistically significant (Student’s t-test, truncation: permutation-based FDR = 0.01, S0 = 2, Perseus 1.6.0.7 software (Max Planck Institute of Biochemistry, Martinsried, Germany). Figure S2 shows the volcano plot in detail: (e) Volcano plot that shows the differences in protein abundance in the EV fraction (in red) and in the WhL (in black) for LC cell lines. Overall, 1622 proteins identified by at least 4 unique peptides per protein were statistically significant (Student’s t-test, truncation: permutation-based FDR = 0.01, S0 = 2, Perseus 1.6.0.7 software (Max Planck Institute of Biochemistry, Martinsried, Germany). Figure S3 shows the volcano plot in detail: For (d,e), normalized data of the LFQ intensities were used for visualization of the protein level. The LFQ intensities were log2 transformed. Differences in protein abundance (taking into account the log2 transformation) are shown on the x-axis, while -Log p (log10 transformed p-value) is plotted on the y-axis. Tissue-specific EV proteins that were also determined to be universal markers were highlighted in red. Detailed data are presented in the Supplement 3.

