Figure 5.
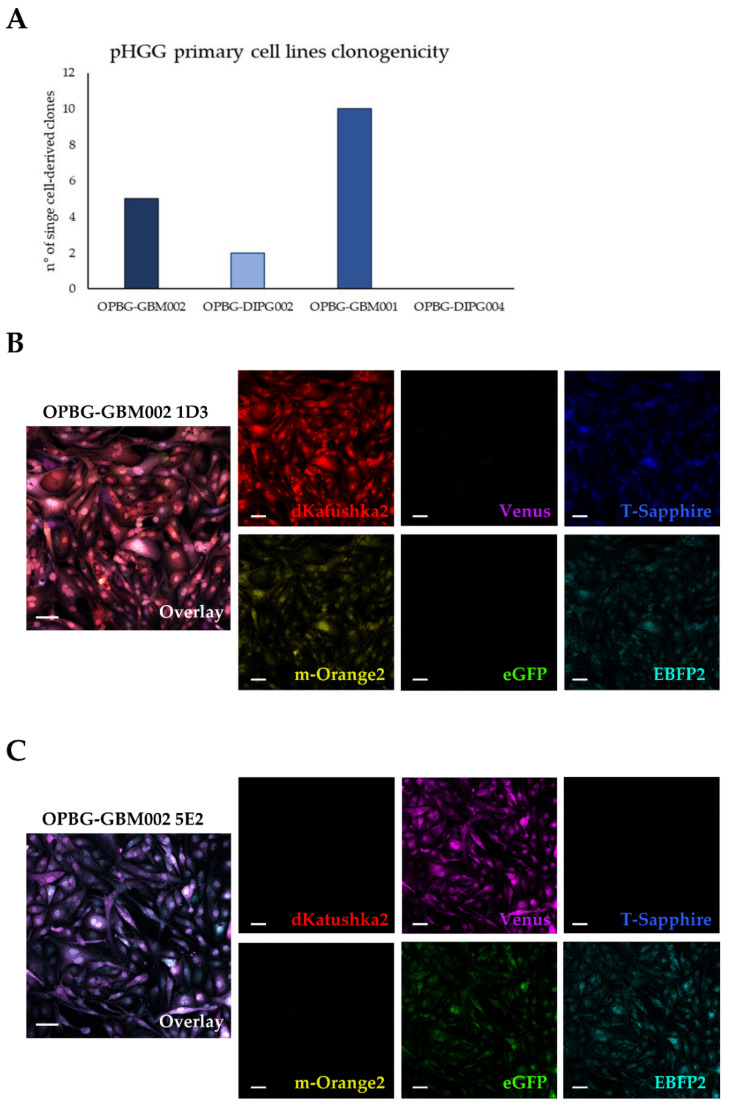
pGBM and DIPG optical barcoded single cell-derived clones analyzed on the confocal microscope. (A) Clonogenicity. The graph shows the number of single cells from which a cell line was established, under 2D laminin-adherent stem cell culture conditions, for the four multifluorescent primary patient-derived cell lines. (B,C) Representative fluorescent images from two OPBG-GBM002 single cell-derived clones are shown with the overlay and the splits for the six fluorescent proteins, which clearly identify the corresponding OBs for each clone: 1D3 (B) expressing dKatushka2 (red), m-Orange2 (yellow), T-Sapphire (blue), and EBFP2 (cyan); 5E2 (C) expressingVenus (magenta), eGFP (green) and EBFP2 (cyan). Fluorescent image acquisition was performed using a Leica TCS AOBS-SP8X confocal microscope. Scale bars: 10 µm.

