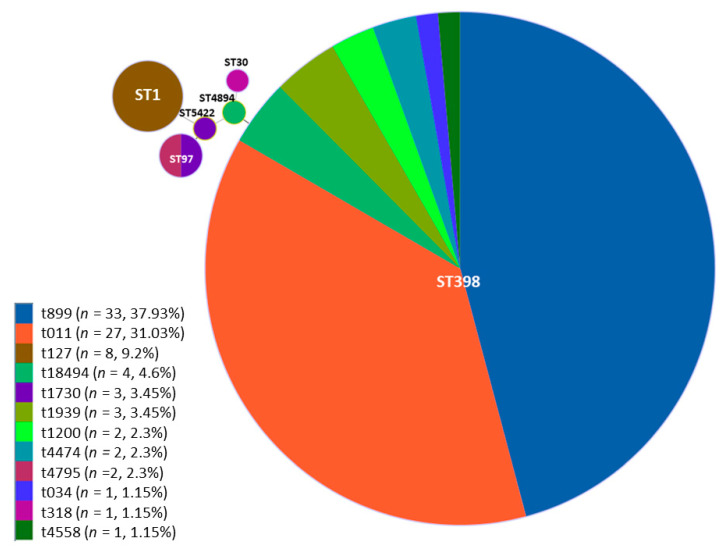
Figure 2.
Minimum spanning tree of the 87 MRSA isolates analysed with MLST. The diagram was constructed by the full eBURST algorithm using the StaphType software v 2.0. Each single sequence type is depicted by a single circle and the size is proportional to the total number of isolates found within. Different colours in the circle indicate the different spa that are included in the same ST.

