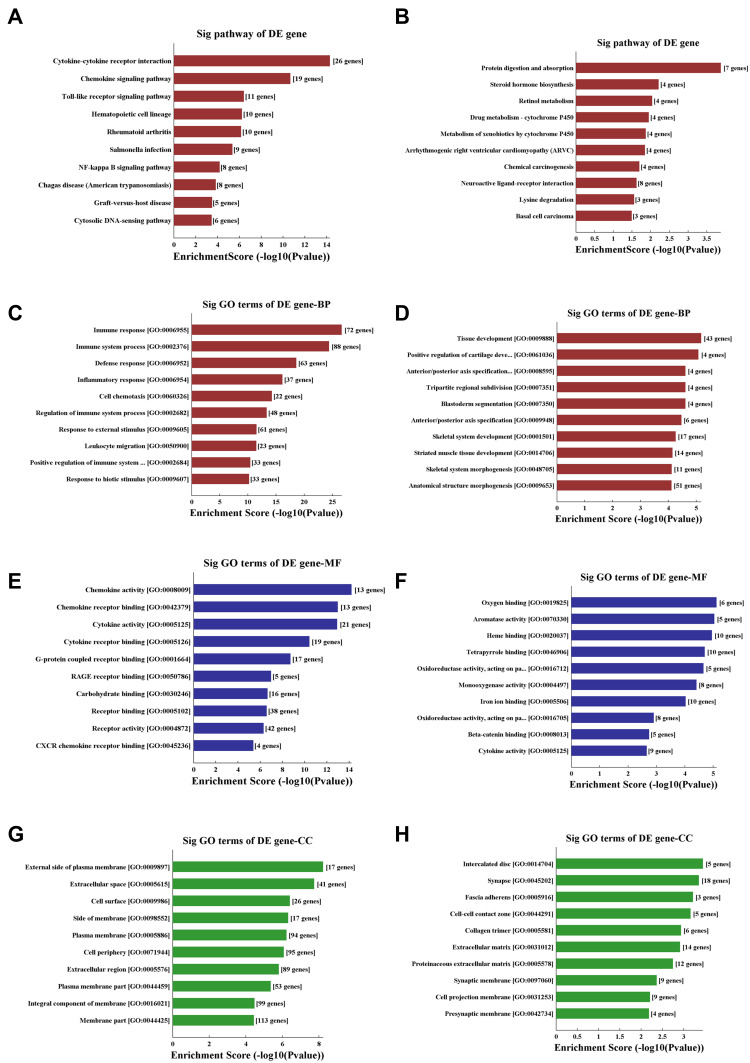
Figure 2.
KEGG pathway analysis and GO enrichment analysis of differentially expressed mRNAs. (A and B) The significantly upregulated (A) and downregulated (B) pathways in COPD vs non-COPD patients. The P-value (EASE-score, Fisher’s P-value, or hypergeometric P-value) denotes the significance of the pathway correlated to the conditions. The lower the P-value, more significant is the pathway (the recommended P-value cutoff is 0.05). (C and D) GO analysis about the top ten counts of enrichment score in the biological process. Up-regulated (C) and down-regulated (D) in the biological process. (E and F) GO analysis of the top ten counts of enrichment score in the biological process. Up-regulated (E) and down-regulated (F) gene molecular function. (G and H) GO analysis of the top ten counts of enrichment score of up-regulated (G) and down-regulated (H) cellular component.
Abbreviations: COPD, chronic obstructive pulmonary disease; KEGG pathway analysis, Kyoto Encyclopedia of Genes and Genomes pathway analysis; GO enrichment analysis, gene ontology enrichment analysis.

